|
It’s been 17 glorious months since we made the long inflation pivot and we’ve performed some commendable linguistic acrobatics in the serial attempt to re-paraphrase the same messaging for quarters as this has literally been the most asymmetric, slowest moving #StickyHigh inflationary train in a generation.
Now, quickly, and because we’re obliged to do the bean counting, let’s both state and visual the obvious.
- Headline CPI = accelerating to +5.4% Y/Y = 159-month high
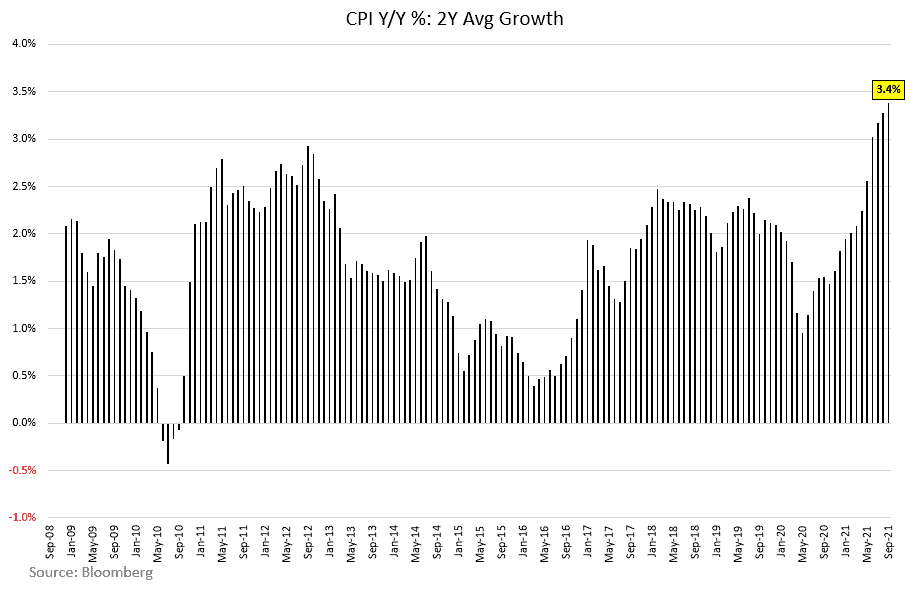
- CPI, 2Y Avg Growth = accelerating +10bpst to another higher-hihg at +3.38%. Recall, using the 2Y avg growth rate is the lowest intensity means for normalizing comp distortions and getting a clean read on underlying trend.
- How about actual underlying inflation … as in the series actually called “underlying Inflation” by the NY Fed and meant to reflect the broad sweep of price trends domestically. We’ll, that accelerated again, also.
- Underlying Inflation = +4.05% Y/Y = another Fresh RoC ATH.
- Median CPI = accelerating +36bps to 2.78% Y/Y = the breadth of inflation is widening despite ongoing moderation in idiosyncratic Pandemic impacted series.
|