CHART OF THE DAY: 4-Bagger vs. Atlanta?

10/12/21 07:38AM EDT

Below is a chart and brief excerpt from today's Early Look written by Hedgeye CEO Keith McCullough. 

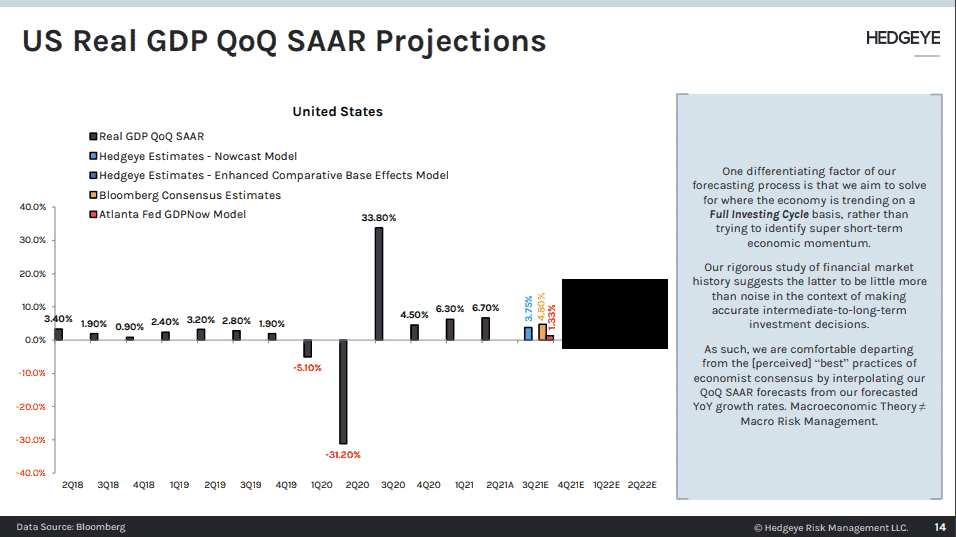
I think a better question is where can the Atlanta Fed model be wrong?

Just to frame it the way linear Econs generally do, the Atlanta Fed number that Macro Tourists anchor on isn’t the year-over-year GDP growth number I just referred to. Most stare at the headline US Real GDP quarter-over-quarter SAAR:

  1. As you can see in the Chart of The Day, that’s the +1.33% forecast of the Atlanta Fed vs. ours at +3.75%
  2. The way to read that is our +5.33% y/y nowcast for Q3 imputes +3.75% q/q … and the
  3. +1.33% Atlanta Fed number imputes +4.70% year-over-year

Since it’s not the average of things that matters in macro, the particular thing you should have noticed on that chart is that our headline US GDP Nowcast for Q4 of 2021 has #accelerated to +6.42% q/q. That’s almost a 4-bagger vs. Atlanta Now!

CHART OF THE DAY: 4-Bagger vs. Atlanta?  - 10 12 2021 7 36 07 AM

© 2024 Hedgeye Risk Management, LLC. The information contained herein is the property of Hedgeye, which reserves all rights thereto. Redistribution of any part of this information is prohibited without the express written consent of Hedgeye. Hedgeye is not responsible for any errors in or omissions to this information, or for any consequences that may result from the use of this information.