While Genting’s Q3 was a disappointment, Singapore is off to a roof blowing start, even eclipsing Macau in some metrics.
Genting Singapore’s disappointing quarter notwithstanding, the overall market rose handily in Q3 as did the important productivity metrics. Net gaming revenue increased from S$983 million in Q2 to S$1,164 million in Q3.
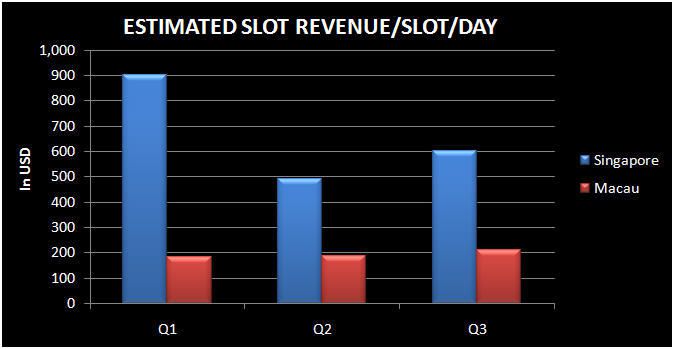
As can be seen in the following charts, win per slot, revenue per VIP table, and revenue per Mass table all increased in Q3. Not surprisingly, win per slot is much higher in Singapore than in Macau where mainland Chinese are not as enamored with machines as southeastern Asians are. Singapore is pretty close to Macau in terms of Mass revenue per table but overtook Macau in VIP revenue per day in Q3. No doubt, the favorable tax rates on Singapore VIP has been a boost.
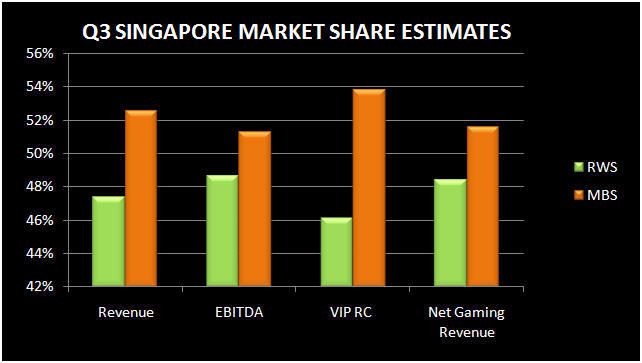
In terms of Singapore market share, with a fully quarter under its belt, Marina Bay Sands (LVS) has moved ahead of Genting’s Resorts World. As can be seen in the last chart, the market share war is close on all of the important metrics, although MBS is winning each battle. We expect MBS to continue to grow its market share.