The following is an in-depth look at consumer credit published by Hedgeye's Financials team. If you're expecting a meaningful pickup in consumer leverage you may want to think again-
Consumers Are Delevering, Make No Mistake ... Importantly, This Will Go on For Years to Come
For those unclear on whether the consumer is delevering, relevering or just taking a breather, we offer some data below aimed at clarifying the matter. There are three pieces to consumer debt: mortgage debt, credit card debt and installment debt (auto loans and student loans). We take a look at each one below for clues on what the trend is and where things are likely headed.
Overall Debt
The place to start is looking at total household debt. We've combined household mortgage debt, credit card debt and consumer installment debt in the charts below to show the trend.
The first chart shows total household debt rose sharply from 2004 to 2Q08, increasing 31.6% in just three and a half years to a record $13.8 trillion dollars. Since 2Q08, every quarter has been marked by a reduction in household debt. In total, consumers have shaved some $701 billion or 5.1% off the 2Q08 total in the last two years.

The second chart is arguably the most interesting chart in this report. It shows the year-over-year change (%) in total household debt looking back over the last seven quarters. The trend is unambiguous. Total household debt is declining, and it is declining at an accelerating rate. For 2Q10, total household debt was falling at a rate of 3.4% year-over-year, the fastest rate of decline since the start of the recession.

Next, we look at the three components of total household debt independently and offer our view and interpretation of each series.
Mortgage Debt
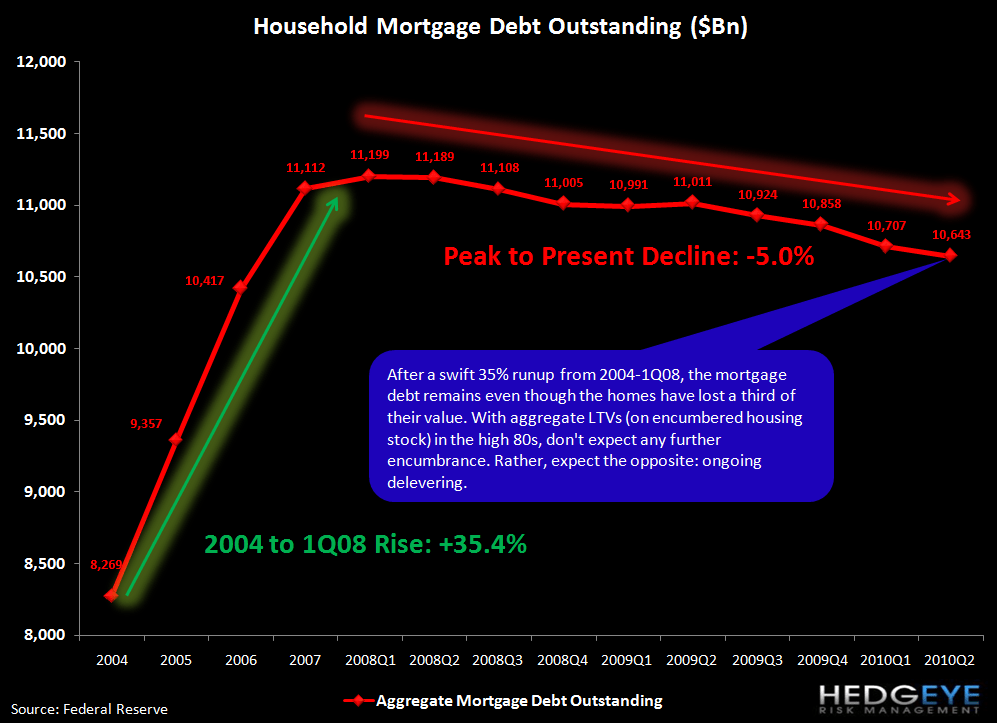
Mortgage debt is the largest piece of consumer debt. Out of approximately $13 trillion in total consumer credit, mortgage debt represents $10.6 trillion, or 81.5%.
This first chart shows the evolution of the housing stock in America on which there is mortgage debt. The blue line represents the total value of the encumbered housing stock, while the red line represents total mortgage debt. The green line at the bottom is the difference, or the aggregate equity value of that housing stock. The purple line is the Case-Shiller 20-city index included to explain the change in the value of the encumbered housing stock.
The takeaways are twofold. First, as this chart shows, just because housing values fall doesn't mean that the debt that was incurred to buy them goes away - it doesn't. It sticks around for a long time, as this country is finding out. Second, there is relatively little collective equity backstopping the housing market. A relatively small 12% decline in home prices from here would wipe it out completely.

The next chart highlights just the debt portion of the above chart. Household mortgage debt rose 35.4% ($3.0 trillion) to $11.2 trillion in 1Q08, and has since fallen 5.0% ($556 billion).
Next we show the aggregate equity position and LTV for the encumbered housing stock of America. For a frame of reference, let's think about how long it will take for LTV ratios to come back simply to where they were five years ago, circa 2004-2005. This seems like a reasonable yardstick, as this was a period of profligate consumer spending - what the market is hoping we'll see a return to. Currently the aggregate LTV of all mortgage holders is 88.4%. We are bearish on the outlook for home prices, and, as such, we assume there is unlikely to be any material appreciation, even in nominal terms, for a long time.
Consider the following example. Imagine that the US encumbered housing market is an analog to one household with one big mortgage. Assume that their home wasn't going to rise in value for many years. Assume that they have a 30-year mortgage that they're 3-4 years into at a 5.5% rate. The home is worth $175,000 and they have a $154,700 mortgage (88.4% LTV). Assume they aren't interested in taking on more debt until that LTV gets back to where it was in 2004-2005, namely in the 60-62% range. Calculating the amortization, you'll find that it will be 14-16 years before this household pays down its mortgage to levels consistent with a 60-62% LTV. We're aware that this analysis relies on several key assumptions. The point, however, is that even with modest inflation in home prices it will be many years before these LTVs get back to levels consistent with even those observed in the middle part of this past decade.
Ultimately, we expect 10-15 years could pass before LTVs get back down to a level where releveraging can begin. This conclusion is profoundly different than most other predictions about when leverage will resume.

For those who think that mortgage debt doesn't matter as a growth channel for the commercial banks, think again. The oft-held assumption that most of the mortgages in America are at Fannie and Freddie is missing the point. As the chart below shows, of the $10.6 trillion in household mortgage debt outstanding, roughly 27%, or $2.86 trillion is held by commercial banks. For reference, commercial banks hold $6.2 trillion in total loans, so to anyone who would argue that a prospective decade-long deleveraging in household mortgage debt doesn't matter to the growth prospects of the banks we would suggest otherwise.

Credit Card Debt
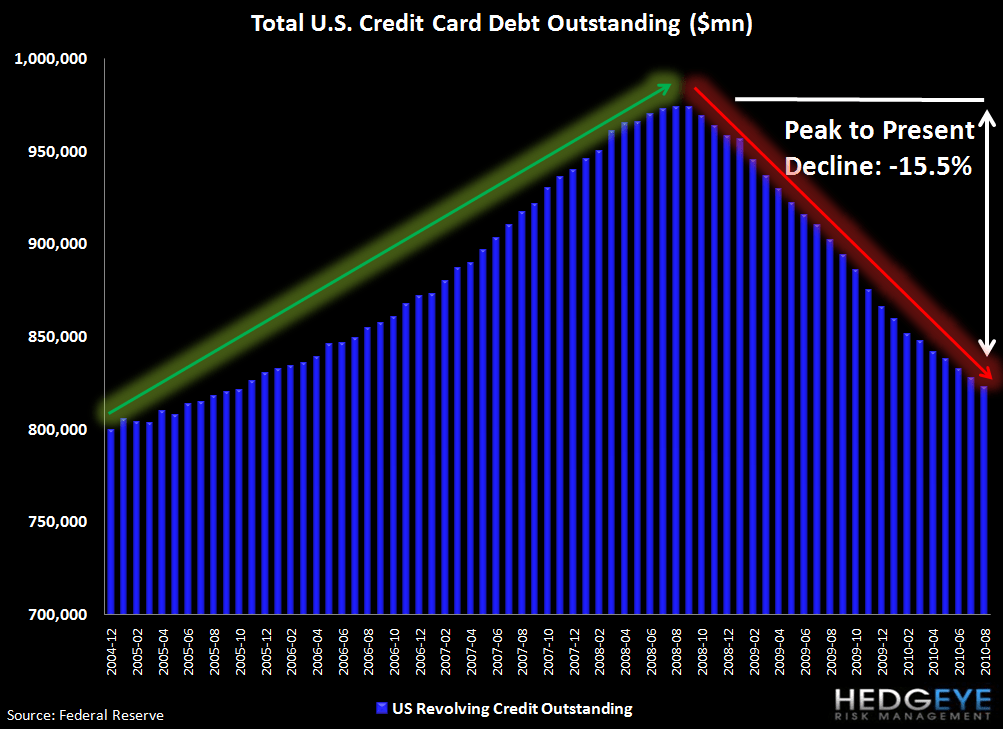
Credit card debt is an important piece of the puzzle, but at $822 billion it now only represents 6.4% of the total, down from 7.6% in 2004.
The first chart shows that credit card debt, in aggregate, has fallen 15.5% since Lehman's bankruptcy, a cumulative decline of $151 billion dollars.
The second chart shows the year-over-year growth rate of total credit card debt. While there was a clear inflection point in February, 2010, we would caution strongly against getting overly excited here. Extrapolating the trajectory over the last six months, it will take two years for credit card debt to stop shrinking, and we doubt that growth thereafter will exceed GDP growth. Our firm expects that in light of the United States' high and rising debt to GDP, GDP growth will remain in the low 1% range for many years to come. Now some might point out the positive marginal benefits of a less bad year-over-year reduction in revolving consumer credit, and there's truth in that. However, it's a long way from assuming that balances stabilize to assuming that growth returns to pre-Lehman rates.

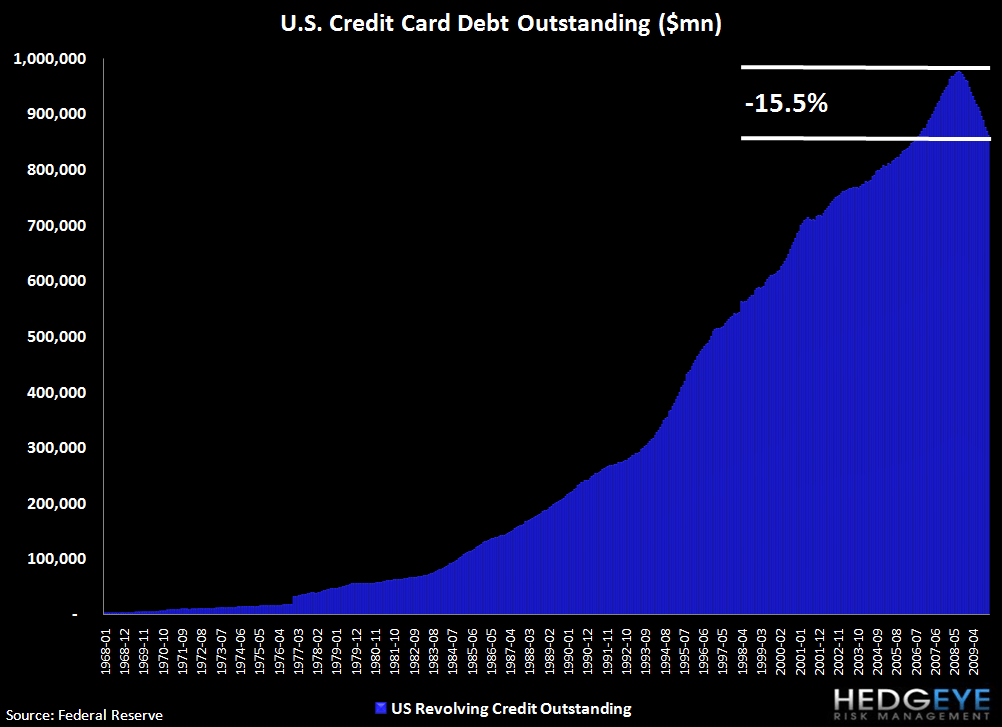
The next chart shows the magnitude of the reduction of credit card debt over a longer time period - going back to 1968 - the inception of the series. We've never seen anything even remotely comparable to the paydown being seen today. This should tell you that there is a wholesale consumer mind shift taking place with respect to their attitudes around credit.
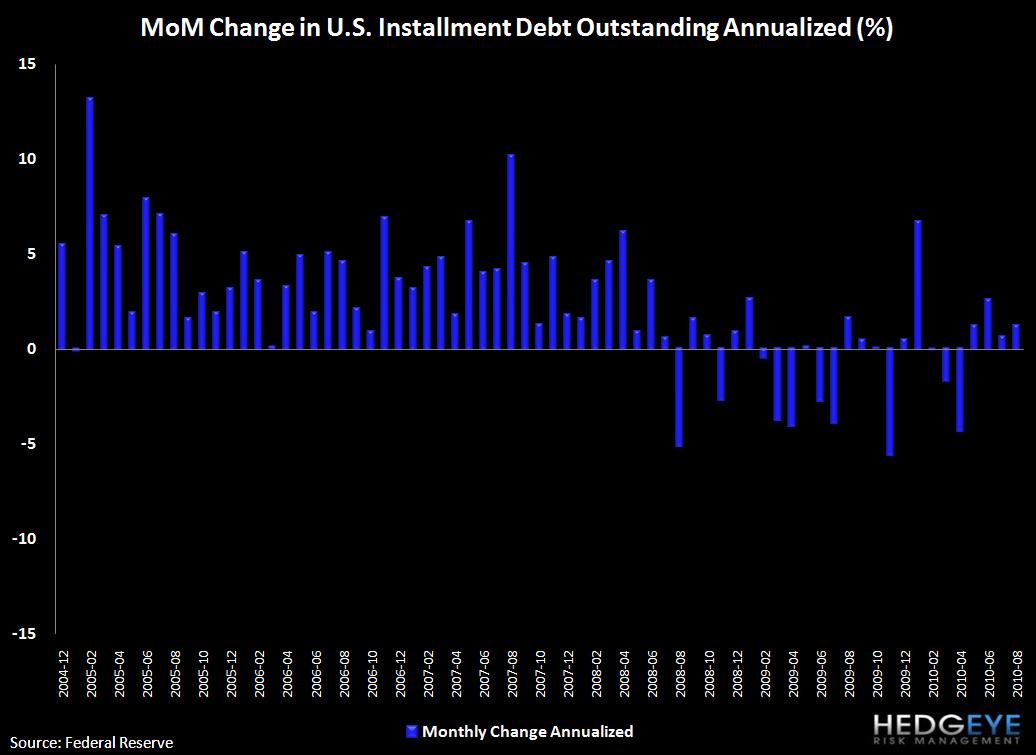
The following chart shows the rate of change expressed as month-over-month annualized. This is the way in which the Federal Reserve reports the data.

Installment Debt (Auto Loans & Student Loans along with Miscellaneous, i.e. RV loans, etc)
Finally, installment debt is $1.6 trillion, or 12.2% of total consumer debt, with auto loans the vast majority of that (~80%). Installment debt has remained steady throughout this recessions principally because of the auto piece. A car has become a mainstay of today's economy. The vast majority of Americans need a car to work or to do anything, outside of a handful of densely-populated cities. As such, it is not surprising to see installment debt remain relatively stable during recessions. It's also worth pointing out that an important driver here may be the fact that the much smaller piece of installment loans, namely student loans (~15%), is still growing so fast that it offsets a nominal rate of decline in auto loans leading the overall installment loan category to appear flat to down only slightly.


Conclusion
We doubt that consumers will come back to the debt trough anytime soon. The ultimate gate on further consumer relevering is the housing market. Consumers conceptualize their debt in totality, taking all the pieces in aggregate, and they evaluate their debt relative to their income and their wealth. The lost value in their housing wealth is profound for most families across America. This will, on the margin, keep them wary of taking on more debt for many years to come. For those who believe that old habits will swiftly return, we think the above analysis offers reasonable doubt. We wouldn't bank on a return to profligate, debt-fueled consumer spending anytime soon.
Joshua Steiner, CFA
Allison Kaptur
