Below is a chart and brief excerpt from today's Early Look written by Financials analyst Josh Steiner.
|
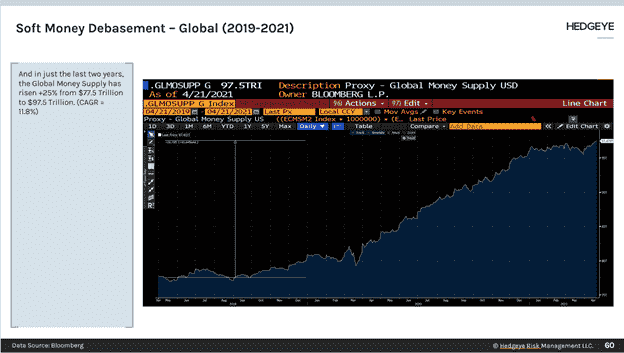
Here’s a question. Do you know by how much the global money supply (M2) has increased since 2003? It has risen by 295%, from $25 Trillion to $98 Trillion, a CAGR of 7.9%. $20 Trillion of that rise has occurred in just the last two years, a CAGR of 11.8%. Is it a coincidence that global money supply is higher by 26% in the last two years and median home prices in the US are higher by 25% in the last two years, or that gold is higher by 27% in the last two years? Possibly, but probably not. Both real estate and gold are hard money assets. They both have high stock-to-flow ratios, like Rai stones did in their early days. Each year there are approximately 2,750 tons of gold mined and that compares with the ~200k tons that have been mined throughout history – a stock-to-flow ratio of 72x (200/2.75). US Residential real estate has a similar stock-to-flow ratio (93x) on the basis of roughly 1.5M new units added per year on an existing base of 140M. |