Below is a chart and brief excerpt from today's Early Look written by Hedgeye CEO Keith McCullough.
|
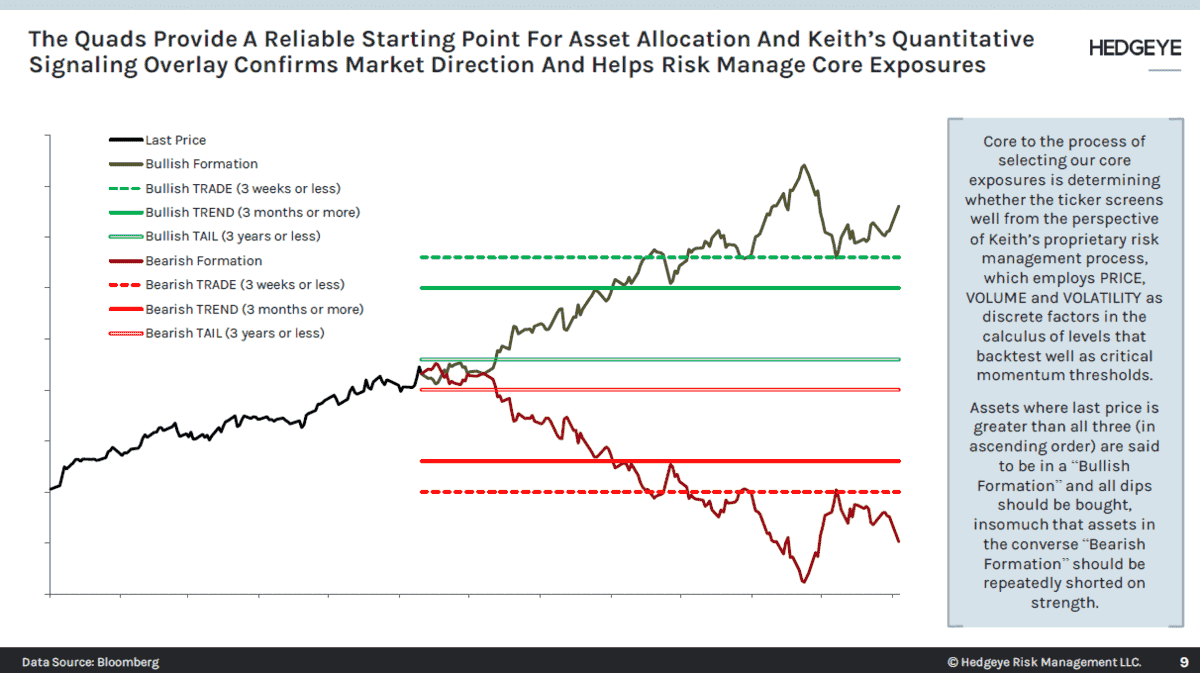
Chinese stocks were down another -1.1% overnight taking their 2-day drop to -2.0% after reporting more than just “selling some strategic reserve commodities.” They reported more #Quad3 Stagflation: A) Chinese Industrial Production #slowed (again) in May to +8.8% y/y vs. +9.8% in April The #slowing of it all matters WHEN it’s within a cyclical slowdown that is also secular. In Hedgeye vernacular that’s when: A) The Cycle, or the @Hedgeye TREND, which is “3-months or more” (i.e. quarterly analysis) runs into the *To my little kitty copy-cat fans out there, that’s slide 9 in the Hedgeye Macro #process deck. It’s been there for a long time. I’ve always used this multi-factor, multi-duration #process that we trademarked as TRADE/TREND/TAIL, for one very specific lesson I learned while running money on the Buy Side: solving for WHEN matters most. |