
Q3 earnings season is winding down right where it started. The internals were again positive market catalysts, especially for prolonged relative performance in sectors we’ve liked all year. Below we provide bulleted, key takeaways that serve as both a recap and outline of forward-looking catalysts.
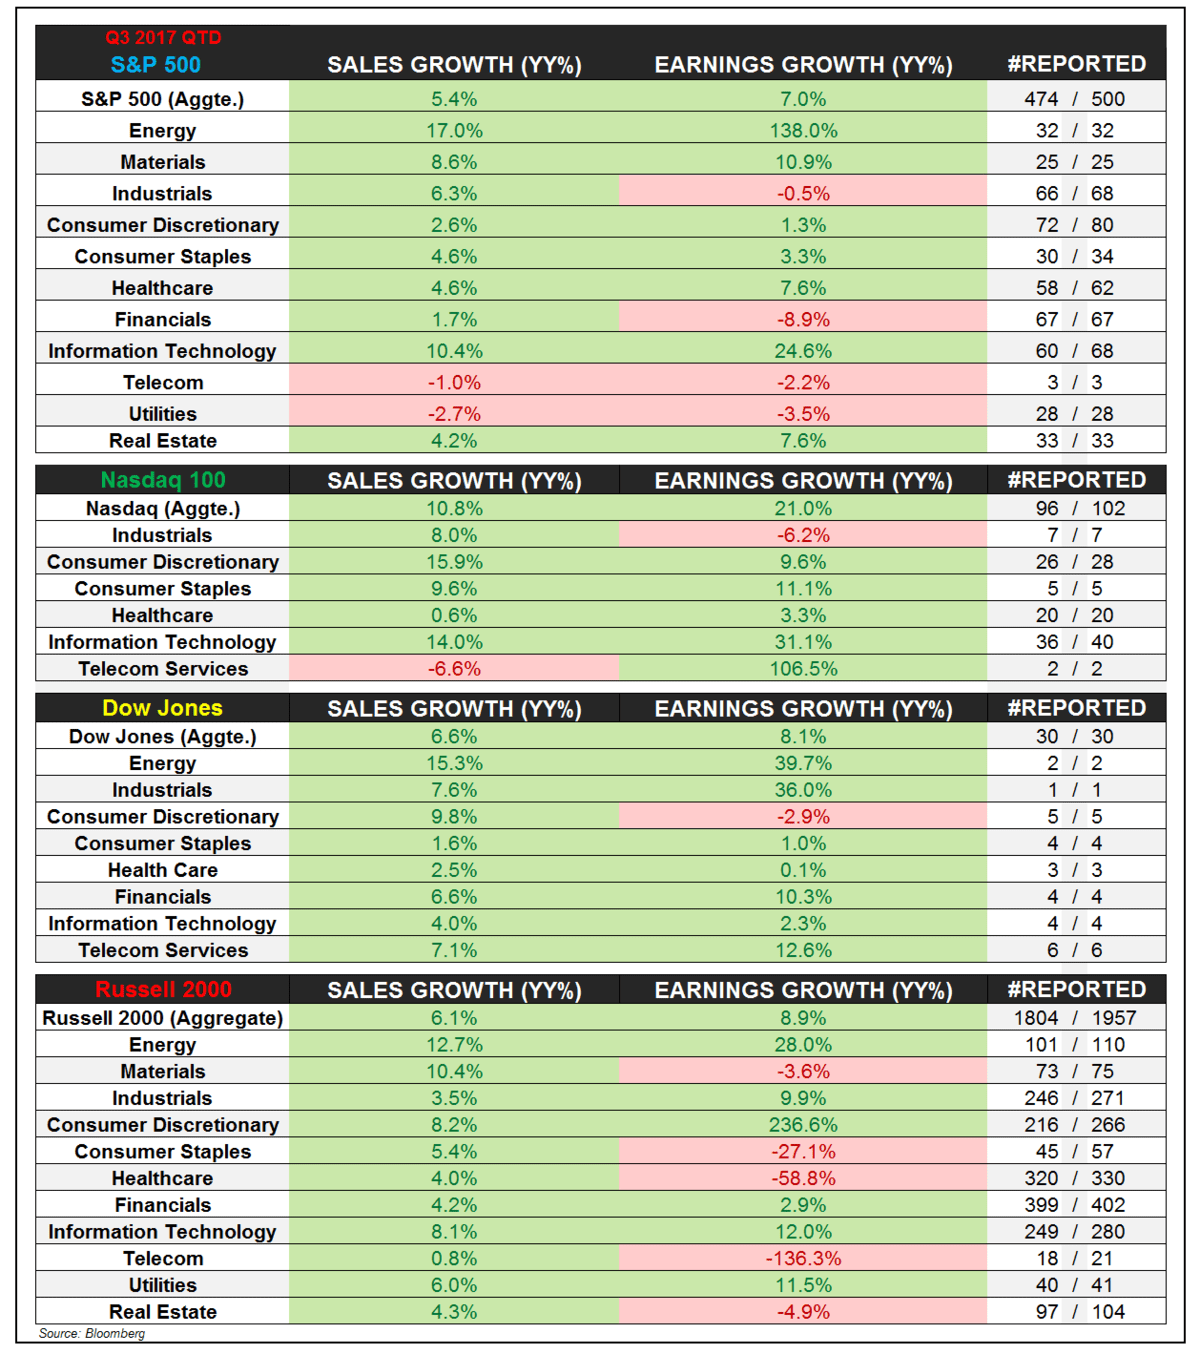
- Earnings Growth: 474/500 companies in the S&P 500 have reported an aggregate earnings growth rate of +7.0% YY for Q3. As expected, the result was a telegraphed second derivative slowdown with very positive internals in the technology sector specifically.
- Technology Earnings: S&P 500 information technology EPS growth has come in at +25% YY for 60/68 companies that have reported. Within the Nasdaq 100 where aggregate earnings growth is +21% YY, information technology companies have reported earnings growth of +31% YY for 36/40 companies. The multi-quarter steep trajectory in tech sector profit growth has continued.
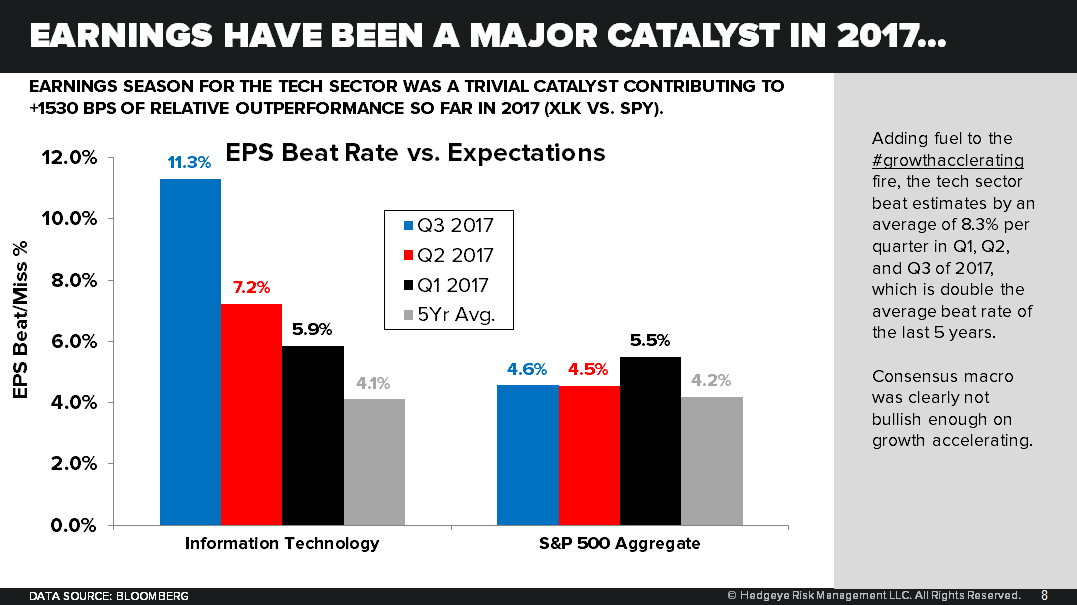
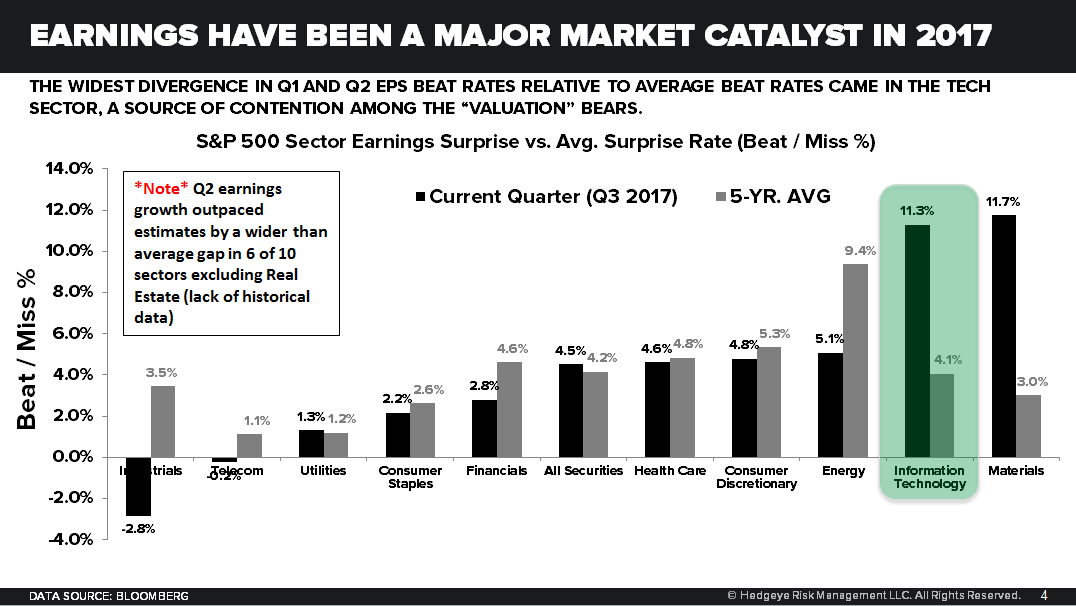
- Beat/Miss Dynamics: Sticking with technology, beat rates reveal that consensus was not bullish enough on growth accelerating at any point this year. S&P information technology companies have beat EPS estimates by 11.3% in aggregate which crushed the average beat rate of just +4.1% over the last 5 years.
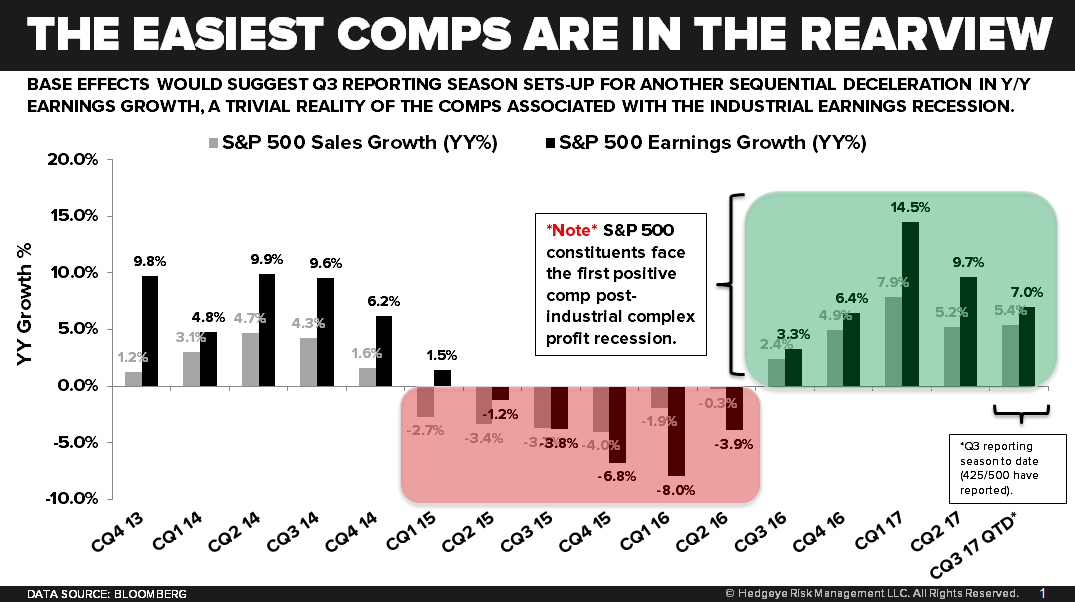
- Past Peak Growth Rates?: Although the earnings season catalyst was a positive one in many pockets of the market, earnings growth has in fact slowed from a second derivative standpoint. We introduced this sine curve reality in our Q4 themes deck. Starting in Q1 of 2018, companies will face a wall of comps. Earnings growth for the S&P 500 was +14.6% YY in aggregate, which was the steepest rate of growth since Q3 of 2011.
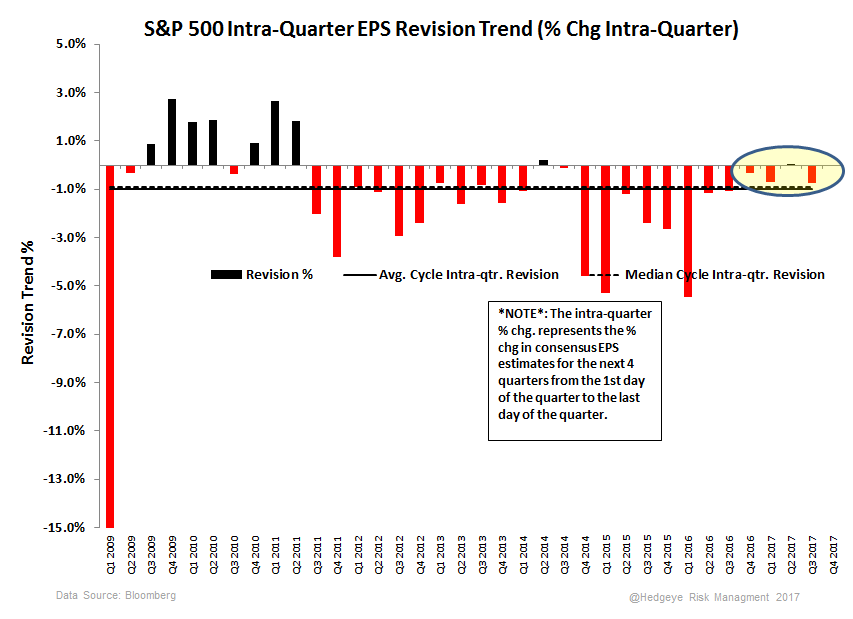
- Market Multiples and Revision Trends: Upside surprises in the tech sector have led to very positive earnings revisions. Despite widely divergent relative performance in the tech sector, the sector forward multiple has expanded little in 2017. Forward 12-month earnings estimates have been upwardly revised by 20% in the sector, and earnings expectations in the sector have increased at an accelerating rate.
----------
Earnings Growth
474/500 companies in the S&P 500 have reported an aggregate earnings growth rate of +7.0% YY for Q3. As expected, the result was a telegraphed second derivative slowdown with very positive internals in the technology sector specifically.
With its underlying constituents, Nasdaq 100 earnings growth has come in even stronger at +21% YY with 96 companies having reported. 40 of those 100 names fall under the information technology sector umbrella where earnings growth is running +31% YY. For context with small-cap tech, earnings growth for 249 of 280 information tech companies in the Russell 2000 is running +12% YY.
From an S&P 500 breadth standpoint, 78% of companies have reported sales growth and 69% of companies have reported earnings growth.

Technology Earnings
S&P 500 information technology EPS growth has come in at +25% YY for 60/68 companies that have reported. Within the Nasdaq 100 where aggregate earnings growth is +21% YY, information technology companies have reported earnings growth of +31% YY for 36/40 companies. The multi-quarter steep trajectory in tech sector profit growth has continued.
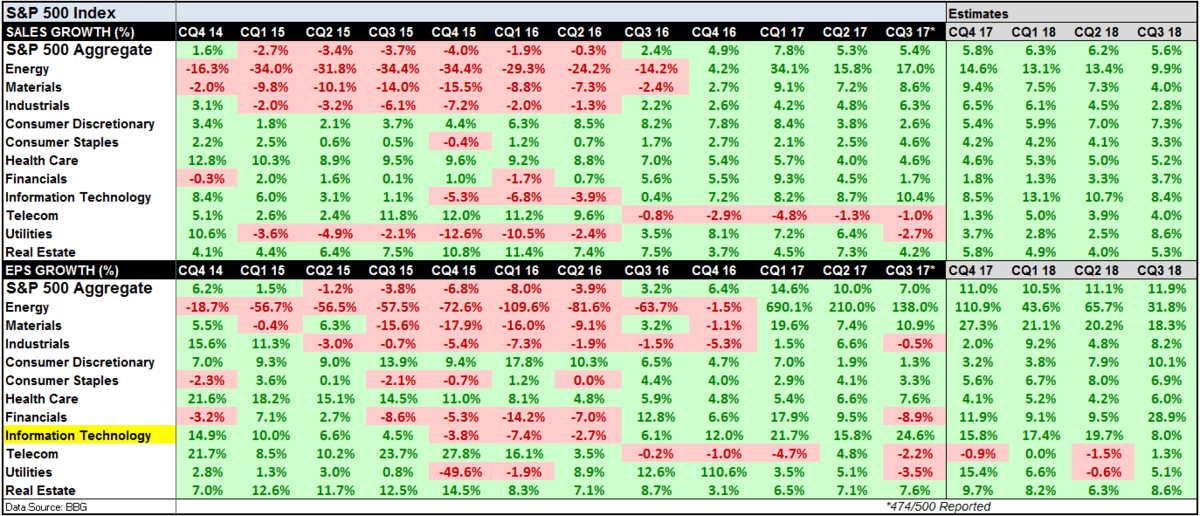
The multi-quarter reality for S&P 500 information technology companies is collective earnings growth of +22% (Q1), +16% (Q2), and +25% (Q3 QTD). As we show below, this momentum in earnings growth came on the back of -7% (Q1 2016), -3% (Q2 2016), and +6% (Q3 2016). The oversimplified conclusion would point to a wall of difficult comps coming with the caveat that the earnings event catalysts won’t print until after the conclusion of calendar Q1 2018.
Beat/Miss Dynamics
Sticking with technology, beat rates reveal that consensus was not bullish enough on growth accelerating at any point this year. S&P information technology companies have beat EPS estimates by 11.3% in aggregate which crushed the average beat rate of just +4.1% over the last 5 years.
Aggregating beat rates in technology for Q1, Q2, and Q3, tech sector earnings have beat estimates by 8.3% on average which is more than double the 5 year average.
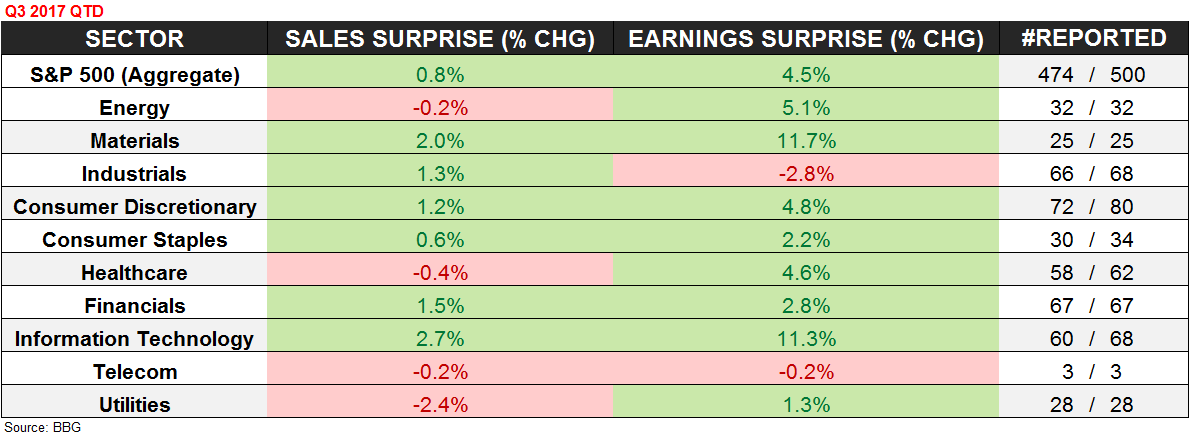
Much like revision trends which we outline in further detail below, S&P 500 earnings beat estimates by a wider than expected margin in Q3 almost exclusively due to the technology sector. Excluding real estate which was recently introduced to the index, earnings beats actually trailed 5yr averages in 7 of 10 sectors.
Past Peak Growth Rates?
Although the earnings season catalyst was a positive one in many pockets of the market, earnings growth has in fact slowed from a second derivative standpoint. We introduced this sine curve reality in our Q4 themes deck. Starting in Q1 of 2018, companies will face a wall of comps. Earnings growth for the S&P 500 was +14.6% YY for Q1 of 2017 in aggregate, which was the steepest rate of growth since Q3 of 2011.
Market Multiples and Revision Trends
Upside surprises in the tech sector have led to very positive earnings revisions. Despite widely divergent relative performance in the tech sector, the sector forward multiple has expanded little in 2017. Forward 12-month earnings estimates have been upwardly revised by 20% in the sector, and earnings expectations in the sector have increased at an accelerating rate.
Adding color to what has been a very positive market catalyst, earnings have beat estimates on the back of muted intra-quarter revisions trends. The typical management of expectations where companies revise forward looking estimates that are too high before beating estimates has been much less drastic the last few quarters.
And to re-iterate the set-up in tech which has become increasingly optimistic, the tech sector is sitting on more than ~1500 bps of relative performance with almost no forward multiple expansion into what will be a much more difficult reality from a comps perspective. Don’t forget that steep growth rates in 2017 came on the back of -7% (Q1 2016), -3% (Q2 2016), and +6% (Q3 2016). This tailwind is now in the rearview mirror.
The newsy topic of tax reform becomes more opaque as a new catalyst because nearly 25% of indefinitely re-invested foreign earnings (IFRE) is concentrated among 9 technology companies. Using some conservative estimates, we walk through some compelling return of capital scenarios for these companies below. Please reach out with any questions, but we detailed these repatriation scenarios in our blackbook last Thursday: LINK


Ben Ryan
dty
