Dear Macro Show subscriber,
You asked, we delivered.
Below is a 16-minute video featuring Hedgeye CEO Keith McCullough and Senior Macro Analyst Darius Dale digging deep into exactly how we arrive at our unique investment conclusions.
In a nutshell, it’s an explanation of our risk management process—from start to finish.
We think you’re going to like what you see.
–The Hedgeye Team
P.S. Please note that we have also included a transcript and slides from the entire video.
Click here to access the associated slides.
Click here to download the historical time series of our US and global GIP Model Quads.
Keith McCullough: Hello everyone. We're going to educate you on our process. Our process is born out of the world changing. If you don't change alongside the world changing you're going to find out the hard way that you probably should have.
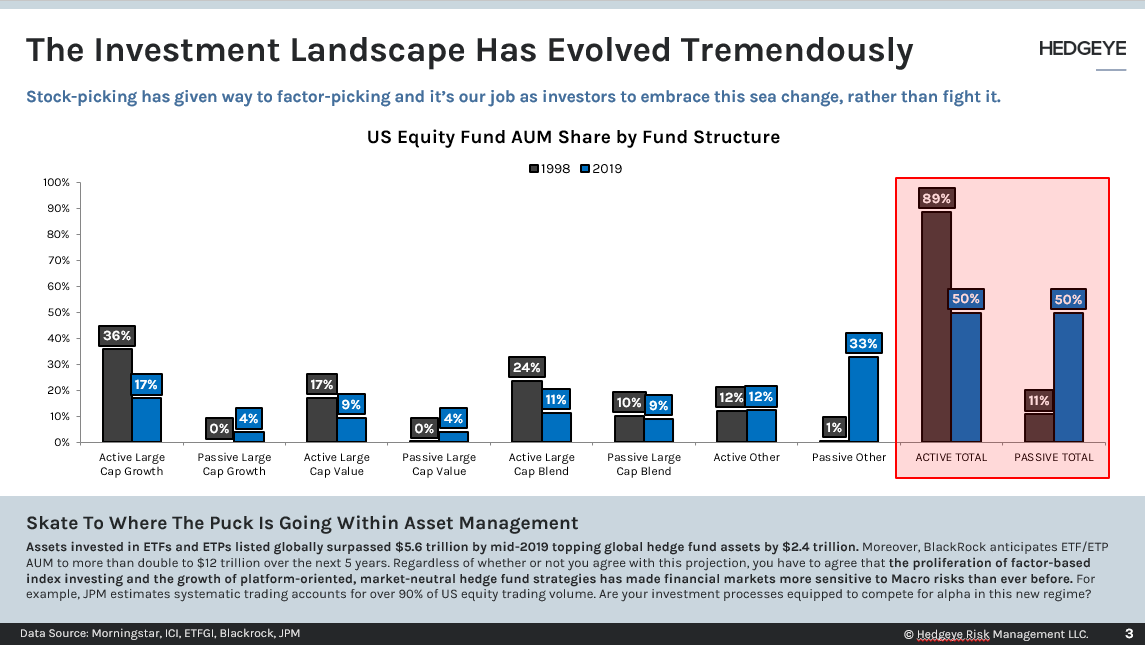
The investing landscape has changed dramatically. It’s our job to embrace this. “Stock-picking” has given way to “Factor-picking.”
If you look at active versus passive assets under management, you see that passive assets under management now make up 50% of U.S. equity AUM versus 11% back in 1998. And what that means is that factor-based index investing and the growth of platform-oriented market-neutral hedge fund strategies has made the markets more sensitive than ever to Macro risks.
Consider this, JPMorgan estimates that systematic trading accounts for over 90% of U.S. equity trading volume. We call this systematic trading that occurs “The Machine.”
Why does this matter? As factor bets swing wildly based on what the market is doing, The Machine chases that. Our job is not to fight The Machine, it’s to front-run the machine. And we've constructed our process to get ahead of the big swings that are perpetuated by The Machine. We'll get to that.
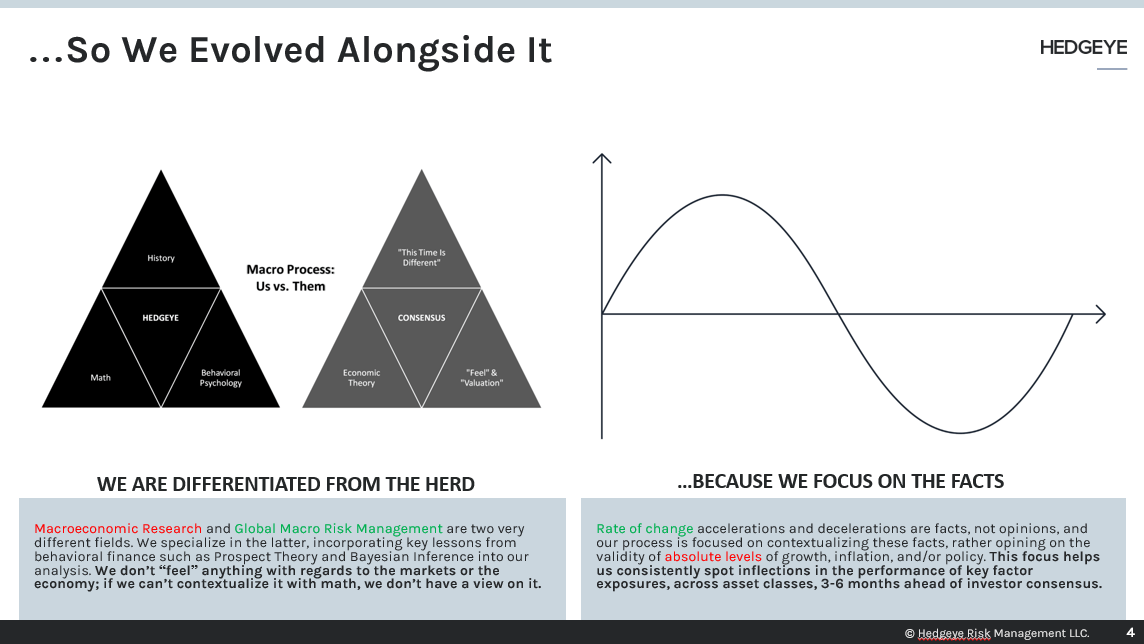
McCullough: We talk about what we do versus Wall Street, the Old Wall as we like to call it. They talk about “economic theory” that is linear. They start with “feel” and valuation.
Darius and I don’t have any feelings about the economic data. We measure and map economic data against economic history. It’s a time series. We also measure and map this data on a non-linear basis using stochastic differentials. If you don’t know what that is look it up.
We’re applying modern day mathematics to get to the right answers. We use a Bayesian Inference process.
What we really want to know is where that next dot on the sine curve is from a growth and inflation perspective in rate of change terms. The data is either accelerating up the sine curve or decelerating down the sine curve. It’s all about accelerations and decelerations. It is not about whether something is “good” or “bad” or “cheap” or “expensive.”
It’s about measuring and mapping the rate of change.
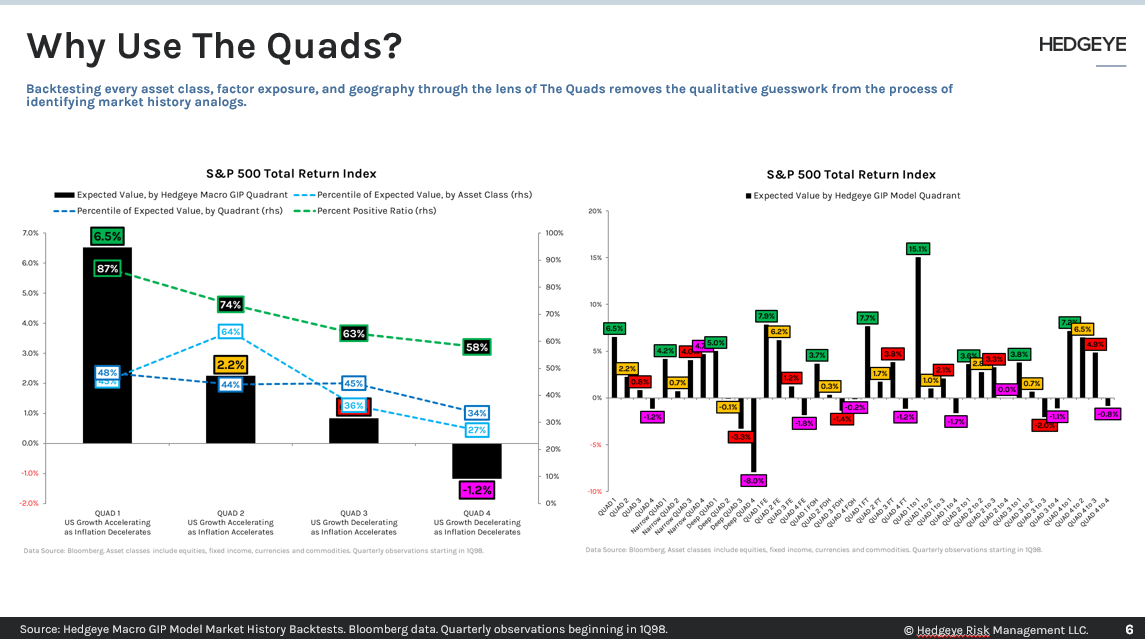
McCullough: We then crystalize all of this economic data into our Growth, Inflation, Policy (GIP) model map. It’s a two-by-two matrix of growth and inflation. It’s a four quadrant model. The quads are broken down measuring and mapping growth and inflation in second derivative terms.
What that means based on our regimes is…
- Quad 1 (Growth ↑, Inflation ↓) : It’s awesome in financial market terms. You have real growth accelerating and inflation falling.
- Quad 2 (Growth ↑, Inflation ↑): Here the economy is heating up. That’s when you have growth and inflation accelerating at the same time.
- Quad 3 (Growth ↓, Inflation ↑): Later in the cycle you typically get economic stagflation. Wage inflation accelerates and real growth starts to slow.
- Quad 4 (Growth ↓, Inflation ↓): Finally, the economy ends in Quad 4, not deeply all the time but that’s where the cycle ends. Quad 4 is where you have growth and inflation slowing at the same time.
What we’re doing is conditionally measuring and mapping what Quad we’re coming from and which one you’re going towards.
We have the expected returns associated with going into a Quad, along with returns associated with our migration map or the returns of migrating from Quad to Quad and finally we have the returns associated with how deep you are going into each Quad. We measure all of these returns for each Quad across asset classes.

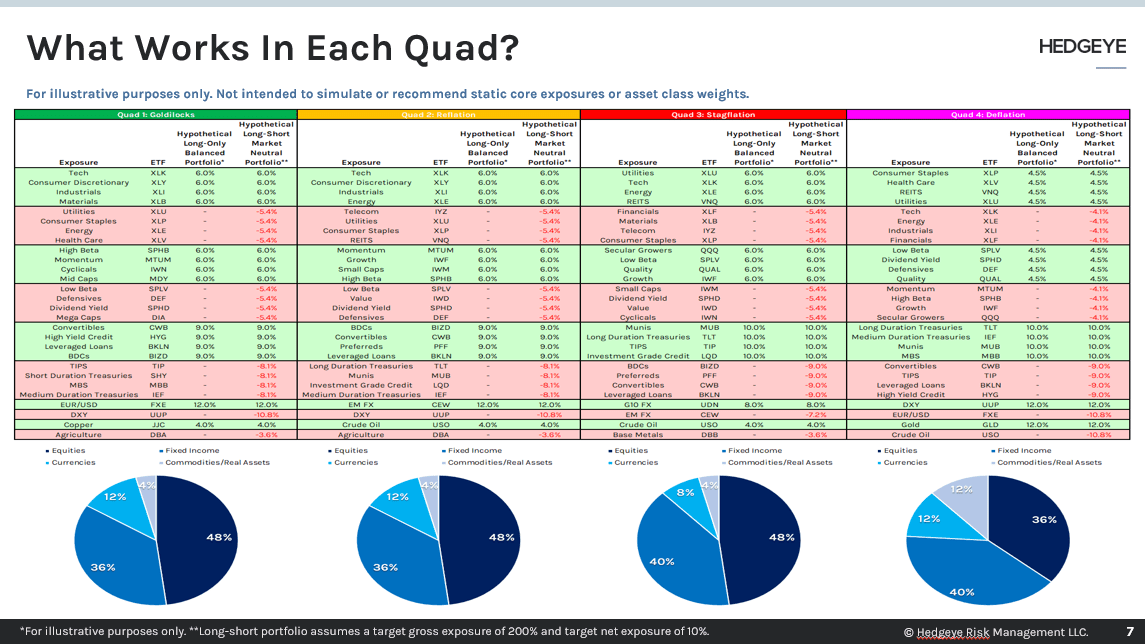
McCullough: And finally we have an optimal portfolio associated with each Quad. Obviously this is for illustrative purposes only (since it’s static) and it’s not meant to be what we’d recommend. But this provides a rough framework for what you’d do in each Quad.
In this rough framework, we break down what sectors to buy and sell, the style factors to own and across asset classes – commodities, fixed income, currencies and equities.
In Quad 4, for instance, you’re quite defensive. In Quad 2, you’re quite aggressive.
For my money, I just want to be aggressive when the economic conditions say I should be and defensive when the economic conditions say I should be. It’s quite similar to the weather. I want to risk manage the environment we have not the one we’d like to have.
One important point to make here – and we get this feedback from a lot of clients – is that Tech (XLK) stocks go up in every quadrant, except what? Quad 4.
In Quads 1 and 2, Technology is the top sector performer. In Quad 3, it’s number 2. In Quad 4, it’s the absolute worst place to be.
McCullough: So this is just one core component of our risk management process. Of course we would never have our investment conclusions based solely on the economic data. The economic data is part A of our “Risk Management A/B Test.”
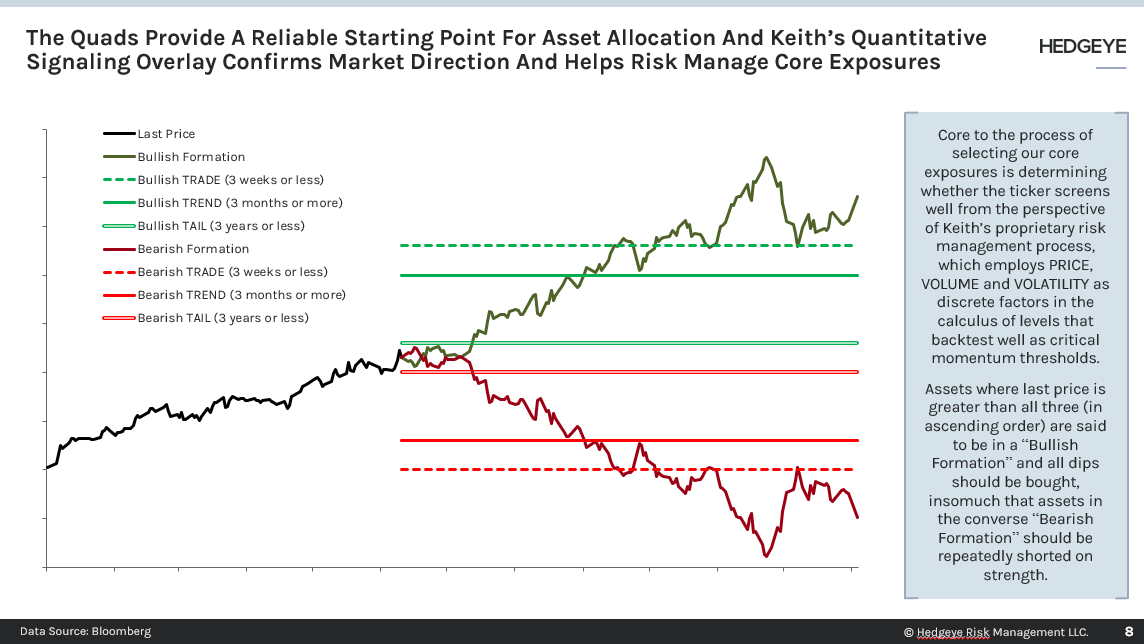
Part B is constantly front-running the economic data by as much as a month or a couple of weeks. That's my Risk Ranges and Trade-Trend-Tail process. It's a proprietary model that measures price, volume and volatility across anything that ticks in financial markets and dynamically provides Risk Ranges for that asset based on those underlying parameters.
What we built is a model that's agnostic to time and space. What we built is a multi-factor, multi duration model. We have three different durations that my model produces Risk Ranges for. What I call them are “Trade,” “Trend” and “Tail.”
- “Trade” is three weeks or less. This is the duration that is most successful in front-running The Machine which cares a lot about 1-month price momentum.
- “Trend” is 3 months or more. That’s where all our back-testing work is most successful by the way
- “Tail” is 3 years or less. That generally captures the economic cycle we’re currently in on the cyclical side.
You see, the market is quite smart and front-runs the economic data. The Machine chases the market. That's why we have two components to our risk management process and one is my Risk Range process. So that’s the modern era, what we were talking about earlier.
We obviously do fundamental research on the secular side (which are the longest of long-term cycles) but in terms of managing your front-end asset allocations and sector styles we’re not so focused on that each and every day.
McCullough: So getting back to our “Risk Management A/B Test.”
So we overlay the quantitative signal. Let’s do an example. In Quads 1, 2, 3, Tech is a top three sector long. If it’s bullish “Trend” and at the low end of the “Trade” range, I buy more Tech. In Quad 4, Tech is a top short. If it’s bearish “Trend” and at the top end of the “Trade” range, I sell Tech. It's that simple.
Now, for a long time, brokerages wanted you to churn and burn your portfolio to generate commissions. Guess what? It just got better to trade our process because now individuals can largely trade with zero commissions. That’s great for those of you that want to be actively front-running The Machine.
For those of you that want to be proactive and use quantitative data to get ahead of how the market is positioned, even better. A lot of Wall Street strategists say, "Such and such asset class 'feels' like it’s overbought or oversold." Whatever.
There's no place for feeling in our process. Why not just look at actual positioning?
What we’re showing is CFTC futures and options positioning. This is the way the market is actually positioned. So let’s stay focused on what the data actually says versus what it feels like. Basically, when positioning gets to extremes (either long or short an asset) you fade that.
So look at the 1-year Z-Score. Not to geek out on that because you can look up what that means but basically when a position gets to two standard deviations on a 1-year Z-score both on the long or short side that’s generally an overstretched level.
On the other side of that chart is the momentum of Style Factors. We look at factor exposures like sales, short interest, debt all these things that The Machine cares about.

McCullough: Here’s another glimpse into what we’re looking at. This is released at 7:30pm every night when options data resets. What I’m really trying to find is sentiment in terms of the one-month window. A lot of hedge funds run market neutral, and quants really care about this, because they constantly have to delta hedge their portfolio directionally against how the market has already moved.
So what we’re looking at here is realized (i.e. historical volatility) versus implied volatility (i.e. Wall Street's expectations for future volatility based on positioning in futures and options markets) in that one-month window. What this gives you is another read on Wall Street expectations of future volatility relative to historical volatility. If there is a large implied volatility premium that suggests, at the extremes, Wall Street is more fearful about the volatility to come. Conversely, an implied volatility discount suggests, again at the extremes, that Wall Street is complacent or capitulatory about the volatility to come.
I know that’s a lot of information. But looking at CFTC data, Styles Factors and Implied versus Realized Volatility adds another layer on top of our Risk Management A/B Process.

McCullough: Darius, the next part of all this is your measuring and mapping. This is important because a lot of fund managers we talk to are more interested in believing you over someone who starts with a political opinion or someone who starts with valuation, that something is “cheap.” I always say to them if something is cheap on the wrong numbers, who cares. What you track is actual data with investable conclusions.
Darius Dale: Well, you might notice we’re 11 slides into this presentation and we have no political views or valuation opinions thus far. Spoiler alert: We won’t have any valuation or political opinions in the rest of this presentation.
So Keith talked a lot about our “Risk Management A/B test.”
A) Our GIP model: What Quad are we in and where are we heading to?
B) Our Risk Ranges: What is the market currently pricing in and what might The Machine price-in at a later date?
You also have to have accurate models of where you are going in future states in the U.S. and economies around the world.
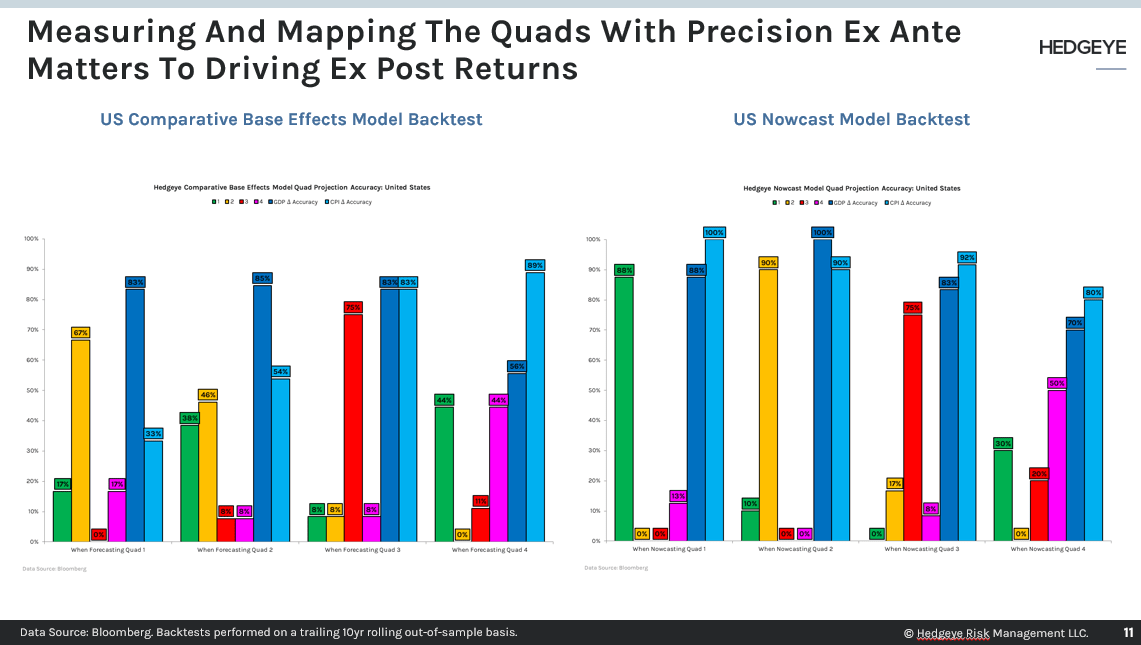
The next slide shows you the backtest accuracy with our comparative base effect model. The other chart shows the accuracy of our Nowcast model with respect to the U.S. specifically. These models guide us on what Quad we should expect in the coming quarters. The key takeaway is that 70% of the time we get growth and inflation right on a six to 12 month forward looking basis using our comparative base effect model. About 90% of the time we get the direction of growth and inflation right intra-quarter using our Nowcast model.
Dale: Why does that matter? From a Bayesian perspective, it’s really important to have your prior and posterior as it relates to the incoming data.
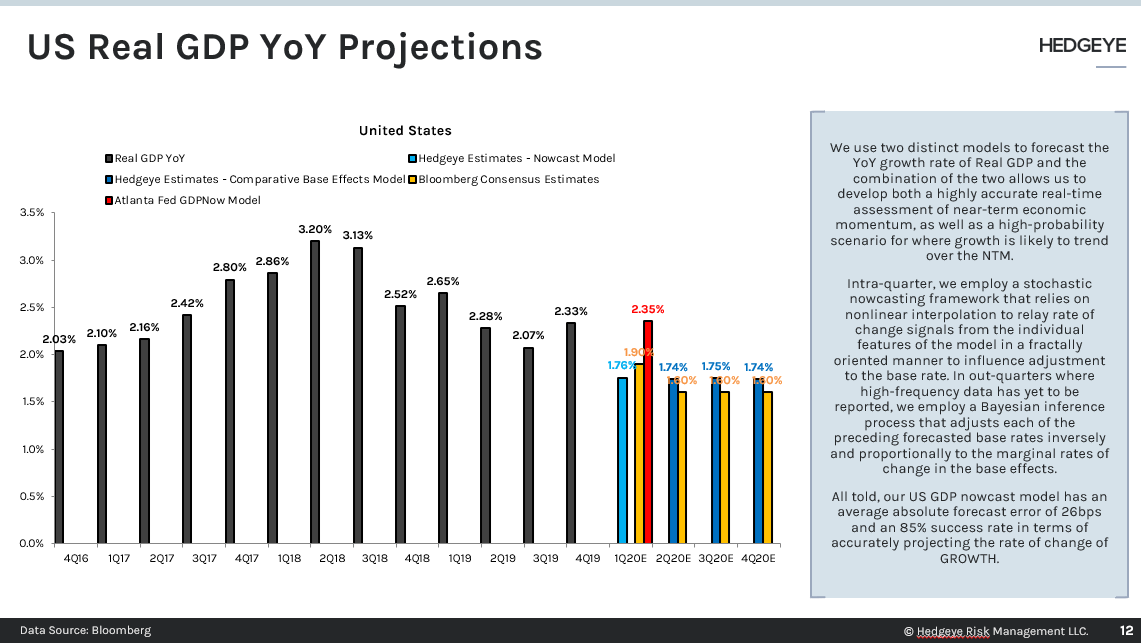
This next chart is the U.S. currently. What we’re really trying to do is “bean count” the rate of change of those black bars. We use a confluence of two models to get to that.
So the green bar is our GDP Nowcast and the blue bars are our proprietary comparative base effect model.
Basically what you can see is that from the 2016 lows U.S. GDP has accelerated materially for eight quarters. That was actually a record. It’s been on a path of deceleration since then.
What would change that model? We have to get time, space, more data and more market signals to determine if continued deceleration is the most likely progression.
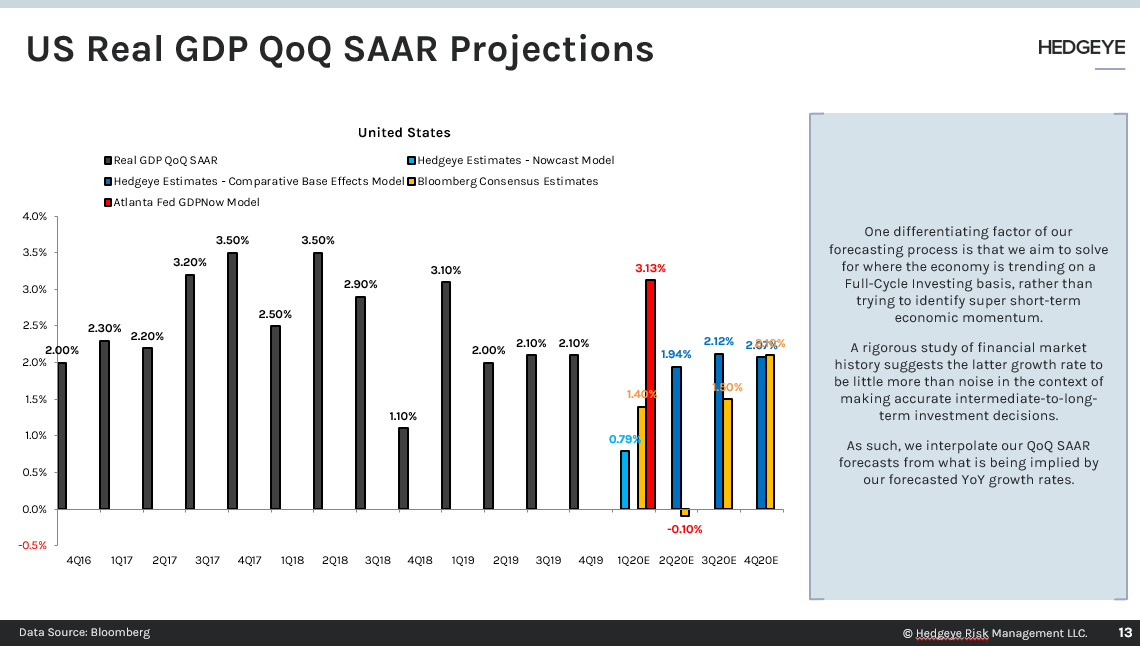
Dale: The next slide is the Quarter-over-Quarter SAAR projection. This is a less relevant measure of GDP. We’ve back-tested this. In fact, we’ve back-tested every economic statistic as it relates to financial markets and the Quads. What we’ve determined is that the year-over-year rate of change in GDP growth matters a lot more to getting your asset allocations right, contrary to Wall Street consensus opinion on the matter.
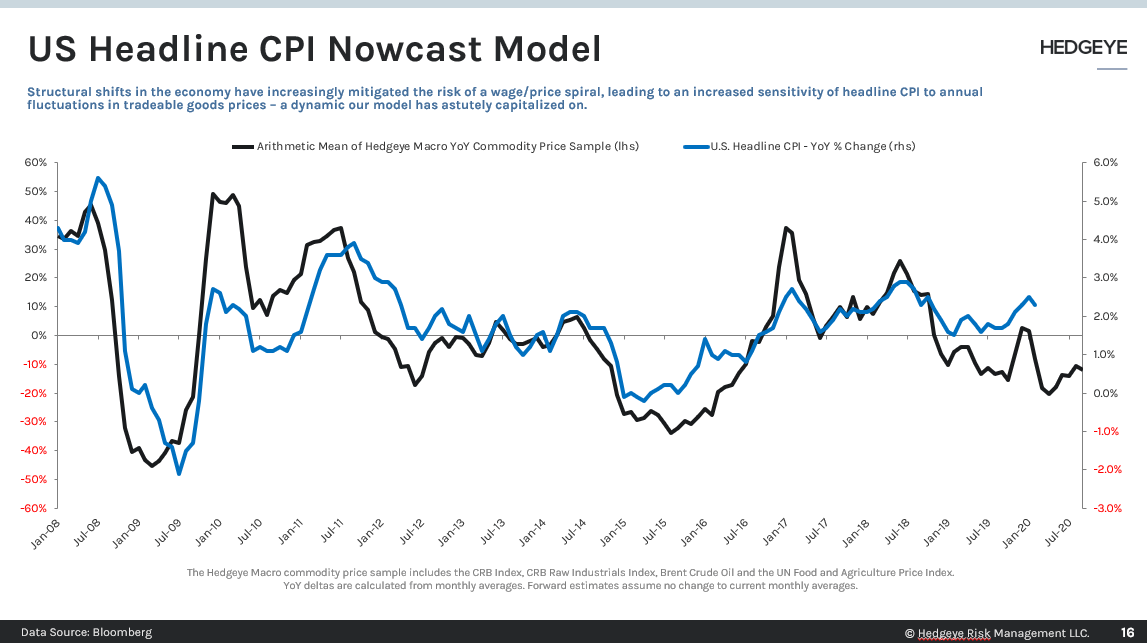
Contrary to Wall Street consensus opinion again, economists look at headline inflation. Our model suggests and market history back-tests suggest that core inflation is what you want to be looking at.

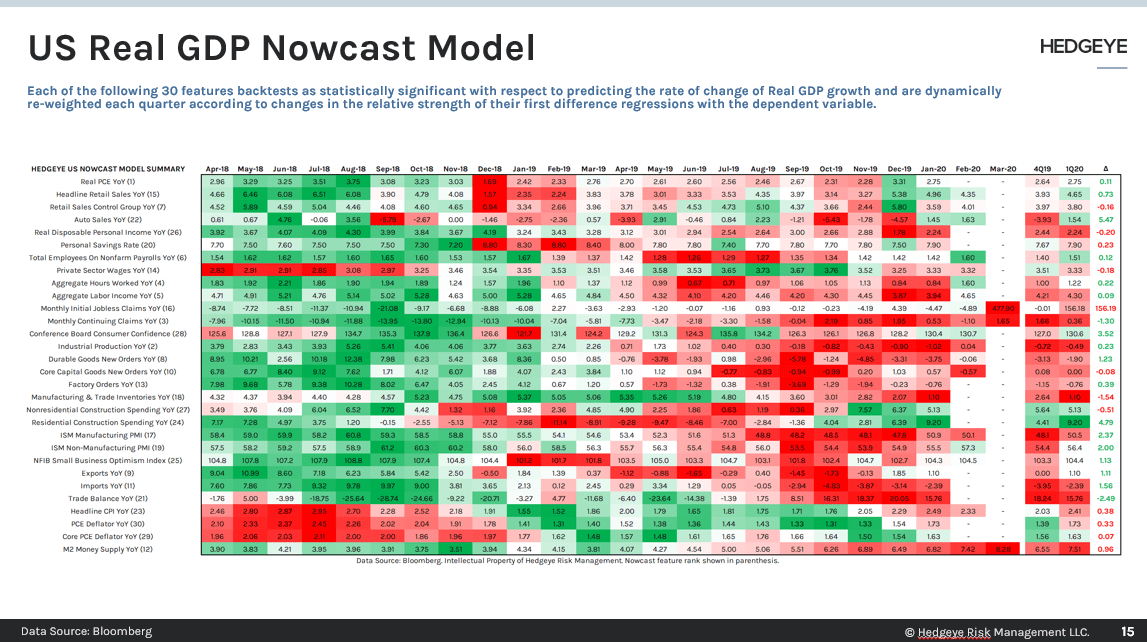
Dale: On this next slide is what I stare at all day. Keith stares at his market signal. I stare at how the data is evolving and changing across the many features in our Nowcast model. Not only where we’re most likely to go. But since it’s hard to sort out the noise of most investor’s political biases and policy biases, this tells you what the economy is actually doing. In that way, you don’t have to anchor on those biases.
On the next slide, much like how we’ve built out Nowcast models for GDP, we have a model for inflation that’s quite accurate as well.
Dale: Again, it’s our job as risk managers to tune out the noise and figure out ‘Where are we in Quad terms? Where are we going in Quad terms? What is the market pricing in? What is the market likely to price in at a subsequent date.’
Again on slide 16, we don’t just run the Quad model for the U.S. We run this for the global economy and every economy around the world as well. What we’re showing you here is the top 20 economies and where they’ve been in Quad terms and where our models suggest they’re likely to be in subsequent quarters. This gives investors a high probability outlook for where all of these economies are on their sine curve for both growth and inflation.
Our models are quite accurate at forecasting growth and inflation across all of these economies to the tune of 65% to 95% accuracy in terms of getting their marginal rate of change right.

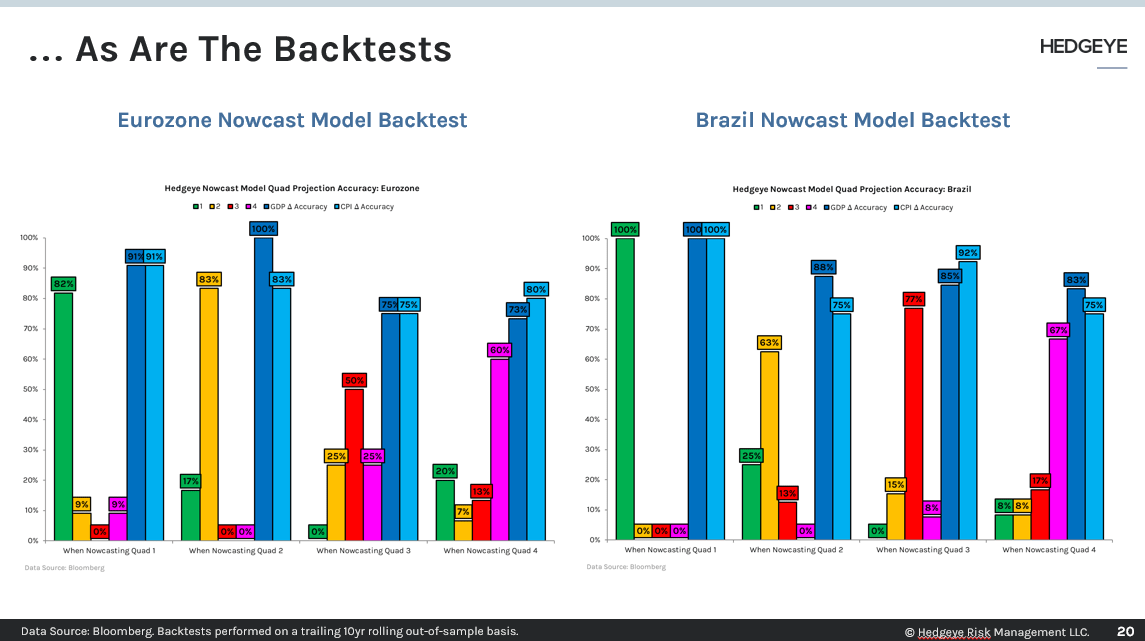
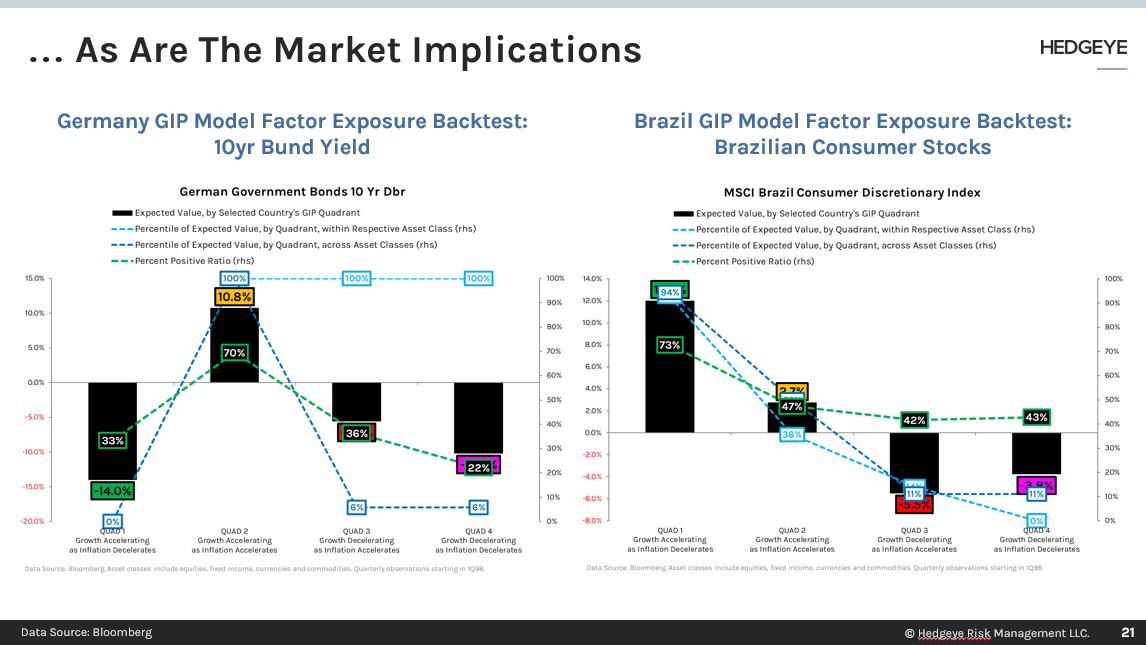
Dale: On slide 21, we’ve backtested every economy's financial markets against their Quad time series and lo and behold the Quads work in every country. What we’re trying to do is use this as a tool for what The Machine is likely to price-in on a one-month, three-month, six-month forward basis.
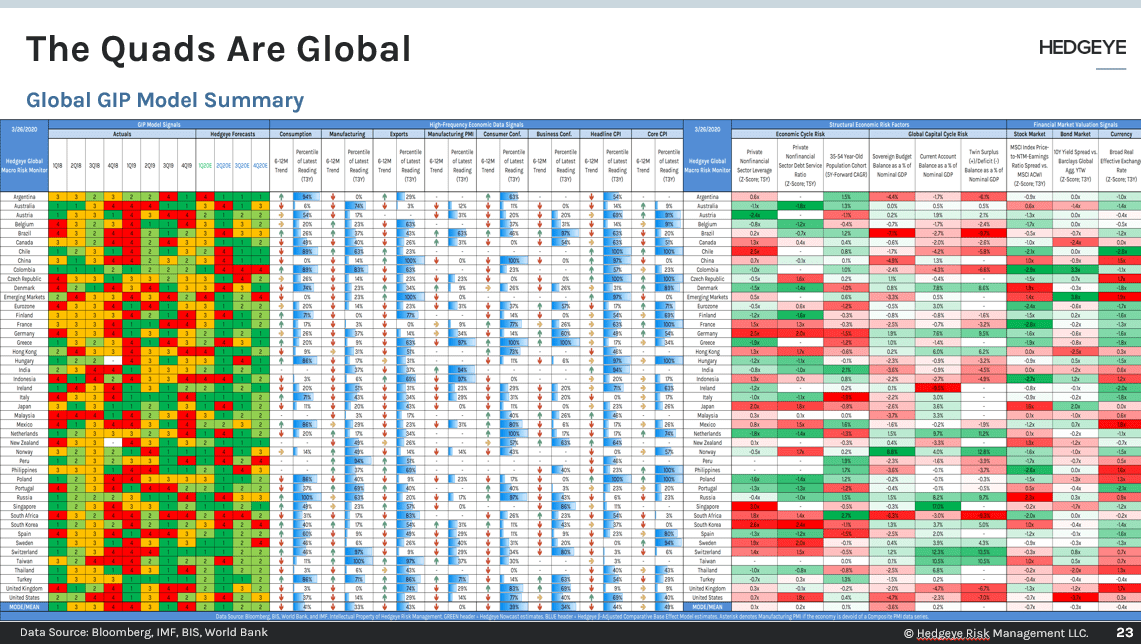
Dale: We have this for Emerging Markets as well. One slide 23, again, we do this for every country on the globe.
It’s all the same model, all the same tools, all the same repeatable process. It’s…
- What Quad are you in?
- What is the market pricing in?
- And what is the market pricing in at a subsequent date?

McCullough: You kept that tight. Thank you Darius.
You should be able to explain your process that way. So I ask you this. What is your process? This is a question I've asked myself every day as an investor and since we started the firm 12 years ago. It’s a question every investor and risk manager alike should ask themselves. The market will certainly ask it of you every single day.
What is your process? What is it that you do?
The alternative is being a Macro Tourist, jumping from headline-to-headline in fear of this and that. Or do you just wake up and jump from time series-to-time series, making your asset allocation decisions when the Quads and our Risk Ranges change?
Like the wind and the rain, you change when it changes.
We’re just trying to help communicate the most data driven process that you can access. Every day I put it up against any buyside shop out there. Thank you for engaging in our process.
