by Stefan Wieler, Goldmoney Insights

The market is currently pricing in a goldilocks scenario of stronger economic growth, stable inflation and partial normalization of interest rates. This has put upward pressure on the U.S. Dollar and downward pressure on gold prices. Importantly, this extremely optimistic scenario is also the only scenario in which gold prices can fall meaningfully. In our view, even under the most optimistic outlook, the Fed will not be able to raise rates to levels that would push gold significantly lower over the long run.
Since the recent US elections gold prices in USD have sold off 7% and prices are down 13% from the year’s highs. This has led some market commentators to declare this as a turning point in the renewed upward trend in gold prices that began last year. In this note we analyze the recent move in prices within our gold price framework with specific focus on three questions:
- Have gold prices moved in line with changing fundamentals (change in long-datedenergy price, central bank net purchases and most importantly, real rates)?
- If not, what is the market pricing in? And more importantly, if prices are in line withfundamentals, what is priced into fundamentals?
- How far can this go if fundamentals move further against gold?
As a first step...
We updated our energy-proof of value gold price framework. For this note we use an improved version of our model which we will introduce and explain in greater detail in an upcoming report over the coming weeks. Within our gold price framework, we find that the decline in the gold price was in line with the rise in real rate expectations.
The recent move in the gold price came mainly on the back of rising real-interest rate expectations (measured by 10 year TIPS yields) as longer dated energy prices remained roughly flat and central banks in aggregate have continued to increase holdings (the Russian central bank was a large buyer again in October).
TIPS yields had dropped to negative territory again in summer this year as the Fed kept delaying the promised interest hikes. Heading into fall, TIPS yields began to gradually move higher to around 10-15bps in October in anticipation of a Fed hike in December. However, the day after the election, TIPS yields rallied sharply to currently 50bps. The move in real-interest rate expectations came on the back of a move in nominal rates. 10 year Treasury yields climbed 100 bps since the trough in July, half of that post-election alone (see Figure 1).

Hence, real-interest rate expectations have lagged the move in nominal rates by about half. The reason is that implied inflation expectations also increased by about 0.5%. We have long argued that the Fed is unlikely to raise nominal rates as long as the inflation outlook remains muted. Hence from a gold pricing perspective, any increase in nominal rates would have to be mitigated by a shift in inflation expectations to some extent, which is what indeed happened over the past few weeks.

In the context of our model, the move in gold prices is slightly larger than what would have been predicted. Our gold price model predicts roughly a USD 120/ozt drop in price from the recent peak on the back of the 60bp move higher in real-interest rates. However, prices declined by around USD 170/ozt. Consequently, current prices are roughly 5% below our model predictions (see Figure 3), roughly 1 standard deviation of the model error.

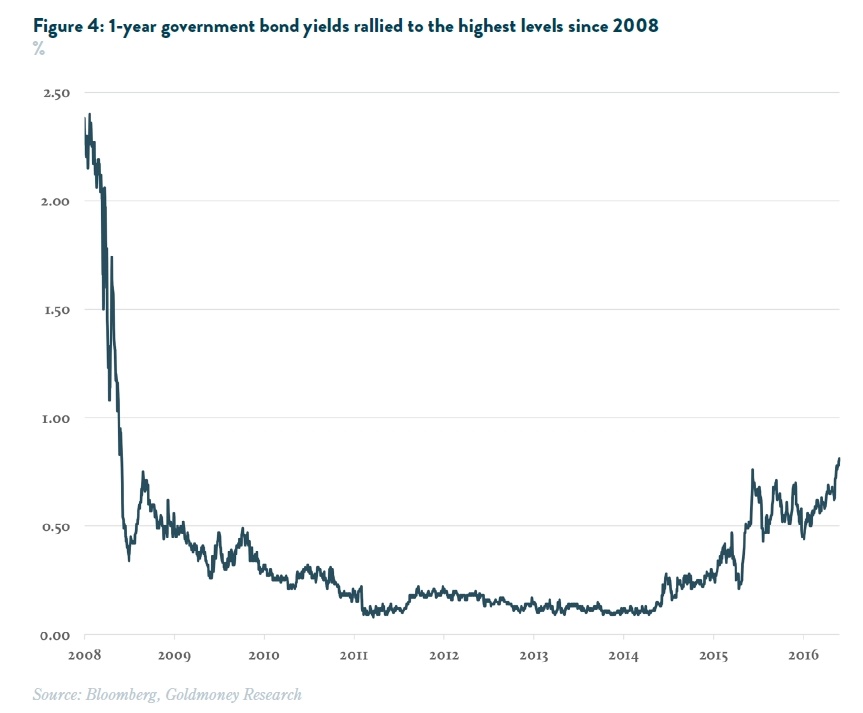
While this is within the normal error margin of the model, we also believe that the model might also not pick up the full extent of move in rates. For example, we use 10 year TIPS yields as input variable for real-interest rates expectations. Gold prices however likely reflect information over the entire rate curve. We believe that expectations further out in the future carry more weight, but the short end of the curve does matter as well. And the move in shorter maturity bonds was nothing short of spectacular, with 1-year yields reaching levels not seen since 2008 (see Figure 4). Hence we conclude that the sharp move lower in gold prices is more or less in line with fundamentals.

This brings us to point two:
If prices are in line with fundamentals, what exactly is priced into fundamentals? The move in the 10 year Treasury yield is large but not unprecedented. 50bp+ upward moves within such a short time-frame (10 days) have happened only five times over the past ten years. However, given that rates began near zero makes this move truly extraordinary. In relative terms, 10 year yields went up over 30% in less than two weeks, which has never happened before.
This market reaction to the election outcome tells us that expectations are now for a goldilocks scenario of stronger economic growth, stable inflation and partial normalization of interest rates (see “Term premia rising: The financial market implications of higher interest rate risk”, November 22, 2016).
One can argue that the economic agenda of president elect Trump - deregulation, tax cuts, and infrastructure spending - will promote economic growth. But the latter two will also – all else equal - increase the budget deficit and thus lead to a higher debt burden. A higher debt level combined with higher rates would put further pressure on the budget deficit. This, combined with potential government spending spree, should get market participants worried about inflation.

Yet while nominal rates have rallied sharply, breakeven inflation expectations have only moved toward the Fed's target of 2%. Hence, it appears that the market is currently pricing in a perfect outcome, where the interaction of all involved factors cancel out all negative effects.
- The shift to fiscal stimulus, lower taxes as well as the boost to business confidence will lead to high economic growth for years to come.
- The resulting increase in tax revenues will be large enough that the increase in spending (infrastructure) and loss in revenues (taxes) doesn’t meaningfully increase the budget deficit and thus debt issuance. The increase in nominal GDP will ensure that government debt/GDP actually shrinks.
- This allows the Fed to raise rates despite the higher debt servicing costs…
- which in turn keeps inflation pressures at bay that would otherwise arise from increased debt issuance and infrastructure spending
The result of this is that real-interest rate expectations can rise which is negative for gold prices. The problem with this scenario is that it is also the only scenario in which real-interest rate expectations can move significantly higher and thus gold lower. Aside from the obvious inconsistencies how the four arguments could interact with each other, this scenario does not allow for any exogenous shocks.
And the potential shocks are manifold.
First and foremost, the rise in rates has already pushed the USD sharply higher. The trade weighted USD broad index (26 currencies) is near an all-time high at the time of writing (see Figure 5). Even the USD main currency index, which measures the USD against a basket of the strongest currencies in the world (EU, JPY,GBP, CAD, SEK and CHF) is at the highest level since 2003.
In the Goldilocks scenario above, the USD would most likely become significantly stronger going forward. This not just reduces US competitiveness but also creates a real problem for many emerging markets. This would also likely not play well into the Fed's fear of deflation either, making rate hikes less likely.
Other risks are that the market underestimates the impact of higher overall debt servicing costs on economic growth as well as the government budget, a potential implosion of the monetary policy-induced asset price bubble (negative wealth effect), lower global growth, a sharp rise in commodity prices or simply a plain old recession.
Any of these scenarios would shatter the current prevailing view.
Importantly, even under the Goldilocks scenario, the downside for gold would still be limited. Assuming that economic growth plays out in a way that allows the Fed to raise rates as planned, the Fed's own forecast is currently for terminal rates of only a mere 2.85%. According to the Fed's own forecast, it will take several years to get there.
Arguably Fed funds rates are currently 2% below the 10 year Treasury yield and thus as the Fed continues to raise rates, 10 year Treasury yields could go much higher. But historically, when Fed Funds target rates peaked, 10 year Treasury yields were roughly at the same levels. Fed funds rates went through six cycles over the past 30 years and on average, Fed Funds target rates were just 0.25% below the 10 year yield when they peaked (see Figure 6).

Measuring over the entire period since the end of the gold standard in 1971, including the Volcker years with double digit interest rates, Fed Fund rates actually exceeded 10 year Treasury yields by 1.23% on average at their peaks. Therefore it is doubtful that the 2% premium of the 10-year yield over the Fed funds target rate will still be at the same level once Fed funds rates peak. Hence even if economic conditions allow the Fed to raise rates to its current target of 2.85% while maintaining its inflation goal of 2%, realized real-interest rates will most likely not exceed 1% much.
All else equal, that would imply a gold price of USD 1100/ozt. Hence, fundamentals would have to improve to the extent that the Fed would raise rates well above its current target rates in order for gold prices to drop significantly below USD 1000/ozt that some bearish commentators claim is now highly likely.
But how likely is that?
The current federal budget deficit will be around USD 540bn in 2016. Of that, USD 260bn will be federal debt servicing costs. The Congressional Budget Office estimates that federal debt servicing costs will rise to around USD 440bn by 2020 rise further to USD 690bn by 2025 as cheaper debt rolls over and needs to be replaced with higher interest-bearing debt. We find the Bureau's Fed funds rate expectations of 3.5% by 2019 too high.
Using the Fed's own guidance of 2.85% terminal rates implies that debt servicing costs by 2020 are likely around USD 400bn per annum but will still be rising therefore as cheaper debt rolls over. The estimates for the budget impact of Mr. Trump's plans for tax cuts and infrastructure vary between USD 4-6bn over 10 years. We go with the estimate of the Committee for a Responsible Federal Budget, a bipartisan non-profit organization, of USD 5.3tn.
In order for Federal Debt/GDP not to increase further, these policies need to generate enough economic growth to boost tax revenues as well as the denominator (GDP). A simple back of the envelope calculation using the Fed's 2% inflation target and the US Census Bureau’s population growth estimates reveals that even the very optimistic prognosis of 3.5-4% growth would still lead to an increase in the Federal debt/GDP level for a number of years before levelling off.

In order for the Fed to raise rates significantly above its current projections of 2.85% to let’s say 4%, without pushing the federal debt level much higher, real GDP growth would most likely have to be over 5%, for a full decade. This growth would have to be achieved not just as government debt servicing costs go up, but private debt costs would raise as well.
While there have been periods of prolonged extraordinary growth in the past, those periods were either associated with the industrial revolution or the recovery from the Great Depression and the US entering WWII. The chances for achieving these kind of economic growth rates look rather dim at the moment. But that is exactly what the market seems to be pricing in now. In such a scenario, gold prices could fall below USD 1,000/ozt.
It would pose a major problem for producers. Most would produce at a loss and gold mining output would fall sharply. But then again, the Goldilocks scenario implies that people would want to hold less gold and more fiat currency. In all other scenarios, gold prices will continue their multi -decade upward trend and likely set new highs over the coming years.
This doesn’t mean that gold can’t trade lower over the short run from here.
What the election result has really changed is business confidence. 40.9% of the respondents in the November Dallas Fed Texas Outlook Survey said that their general business outlook for the manufacturing sector for the next 6 months has improved. That is the highest level since late 2009, which back then simply reflected the fact that people werenot as pessimistic anymore as they were when the economy collapsed in 2008. The service sector confidence level started from a much lower base but the sharp uptick from prior to the election is no less impressive (see Figure 7).

The markets' euphoria over Trump's election has been the match to the tinder that was the expectation for a second – and currently highly likely – rate hike by the Fed in December. A mere two rates hikes in two years falls far short of the Fed's original optimistic outlook.
But in the land of the blind, the one eyed is king. Compared to the central banks of all other developed economies, the Fed looks like a superstar which has boosted US rates and thus the value of the USD. This might last for a while, keeping downward pressure on gold price. But eventually it will become clear currentrate path predictions are still overshooting the more probable reality.
* * * *
EDITOR'S NOTE
This is a Hedgeye Guest Contributor research note written by Stefan Wieler of Goldmoney Insights. Wieler is a Vice President at Goldmoney Inc. He was previously an Executive Director and senior commodity strategist at Goldman Sachs. This piece does not necessarily reflect the opinion of Hedgeye.
