

Here’s something that consistently flies under the radar in almost every conversation we have with investors. This is an analysis that shows the underlying lease profile for every company in the retail supply chain that we follow (about 180 of them). If you’re signed up for our RetailDirect product, the full 180-page deck should appear in your inbox shortly. With this analysis we can see how the underlying lease profile is changing for retail. The punchline is the we’re seeing lease terms stretch to a level we have not seen since the end of the last economic cycle. While not toxic, this is definitely a level that suggests to us that the group is either a) unit growth starved, or b) in search of margin – by stretching out the duration of its lease portfolio. There’s puts and takes by company – but the overall trend is clear, and it has earnings implications.
What does it mean to ‘stretch out the duration’?
First off, let’s calculate said ‘duration’. It really comes down to the ratio of rent minimums carried off balance sheet that are required to be paid over the next 1-2 years compared to what a company is obligated to be pay 5+ years out. Let’s not get too focused on the periods used, as the trajectory will be roughly the same for a given company regardless of the period in question.
For the retail industry as a whole –we have a weighted average duration of 7 years. That’s meaningless on its own. We have to look at this relative to itself, which has shown an upward (negative) rate of change since the Great Recession. It might not sound like much, but look at the chart below.

What Does It Mean When The Duration is Headed Higher?
Basically, it means a company is signing leases it largely cannot afford. To avoid losing the property to a competitor, it is either…
a) Buying Into Escalating Rent Trajectory. This means signing leases with low initial payments, but high (usually dd) rent escalators in the outer years. That way it can book revenue, low rent costs, and worry about paying ‘real’ market rents sometime down the road. This is akin to a family that makes $90,000 a year, and takes out an interest-only 5-yr arm in order to buy that $2mm ‘dream home’ (that probably needs work) in Summit NJ.
b) Buying Time. This basically means signing a lease years before the competition would even consider it. Usually a company will sign about 2-years out from the property open date. 3-years max. But sometimes we’ll see ‘growth’ retailers without the cash flow to compete for premium properties sign up for a property that’s not available for another 4-5 years. It’s pretty arrogant that any company – even the best retailer around – can predict which plot will be relevant more than one Presidential term down the road. Importantly, there’s no way of knowing who the co-tenants will be. So while you think you’re moving next to a Restoration Hardware or Tiffany, you end up next to Olli’s Bargain Basement or Hibbett Sports. This ‘risk’ manifests itself in a growing duration – and while it is a hypothetical number, it represents margin risk that is very real sometime in the not-too distant future.
Check out CRI, FL, KSS, TGT, BURL, KATE, etc… The list goes on.
What Happens For Those Companies Where The Lease Duration is Headed Lower?
Simply put, reverse all the negatives I just called out. A lower lease portfolio duration means that…
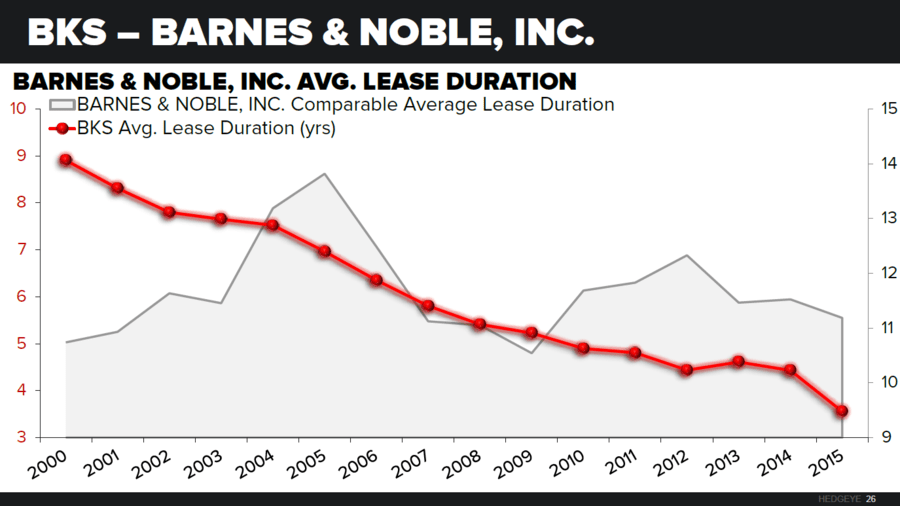
a) Pay More Today, Owe Less Tomorrow. That means long term liabilities come down, and current payments go up. Most would call this bearish as it relates to hitting estimates. But when a management team opts to pay more over the near-term instead of being up against a wall in 3-5 years, we call that proactive risk management. That’s akin to paying off high interest debt, or taking a 30-year fixed mortgage to a 15-year loan – higher payments, but lower interest cost, and lower long-term risk. Check out RL and BKS.
b) One point worth noting is that this would also happen to a company that has just run out of growth or is closing stores with longer-dated durations. Acquisitions can just as easily skew these numbers one way or another.
COMPANY CALLOUTS
Here’s an overview of the implied duration by retailer. One obvious pattern is that the specialty mall-based retailers hover between 5-6 years, while the department stores are almost all twice that level. Of particular note is Target at 20 years, and Kohl’s is 23 years! Let’s be clear about this…KSS is managing its liability profile in a way that assumes it is still actually selling product in its stores in another 20 years. We’d take the ‘under’ on that one.

RL (Bullish): Props to RL – a big liquid name that no one cares about today. The company is definitely doing the right thing as it refocuses on it’s real estate portfolio. Seeing this makes incrementally more positive on RL (which is on our Long list already).

BKS: Here’s an example of a bullish trend. As BKS becomes increasing obsolete, the management team has jettisoned or restructured property agreements such that lease duration has come down by 50% -- offering greater flexibility as it faces more AMZN/Online competition.
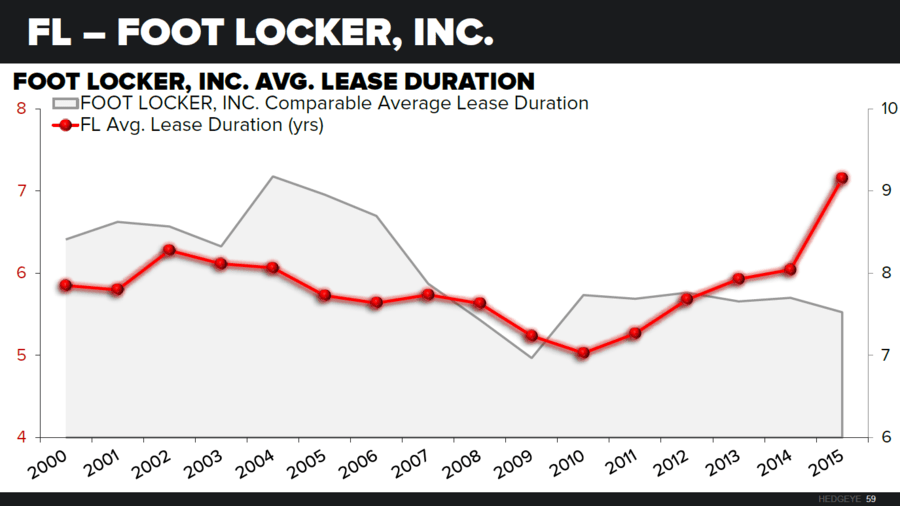
FL: BEARISH. Property age is not egregious, and is lengthened by Int’l stores. But numbers are numbers – they don’t lie. At a time when 72% of its revenue (Nike) will generate 100% of incremental gross profit online over 5 years – this real estate trend is simply not good.
DG: BEARISH. Should a dollar store really be stretching out its lease duration as it adds more marginal locations in an increasingly competitive space? Probably not. This is near-term bullish (lowering rent minimums) but taking up long-term liabilities.

CRI: BEARISH. Same thing. Carters moved into Canada and is increasingly competing in the playwear market (ie competes w everyone from Old Navy to Nike). Still a killer infant brand. But beyond that we’re concerned.

KATE: BEARISH. We generally are positively predisposed to KATE – and think it will be bought by YE17. The the buyer better take note of how the lease duration has changed since this became a ‘Kate-Only’ company.

BURL: BEARISH. Not a name we’ve trafficked in historically. But if you own this name, this chart shows a bad trend management better have an answer to.

