
I was going to go with “This Time Is Different, Month 12” for the title as it carries more contextual relevance but “Red Shoots” is more sensational and click worthy so the former gets the backhanded honor of 1st subheading .
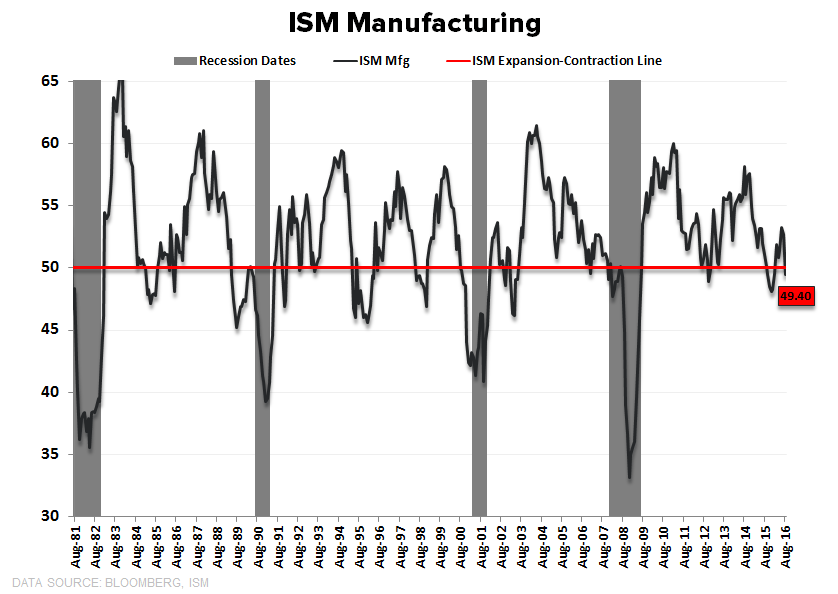
This Time Is Different, month 12 | Industrial Production: Counting the number of consecutive months of growth with a negative sign in front of it probably doesn’t qualify as “analysis” but the stagnation streak in industrial activity has been singularly remarkable.
The Context: Inclusive of this morning’s August data, Industrial Production growth has been negative year-over-year for 12 consecutive months and together with New Capital Goods Orders – where growth has been negative for an epic 18 of the last 19 months – represent the worst streaks of non-recessionary data ever. To now, Industrial Production has also carried the distinction of sending zero false positive signals with respect to recession signaling over the last 7+ decades.
With manufacturing employment and aggregate hours worked in the manufacturing space both down in August (NFP data), the sequential softness in Industrial Activity was pretty well telegraphed. And, of course, as we’ve gradually transitioned away from industrial-centricity as an economy, the magnitude of impact of falling industrial production and its potency as a concurrent-to-lead indicator has similarly diminished. But that doesn’t fully obviate its relevance.
The Conclusion: With industrial Production declining, the manufacturing ISM’s in or flirting with contraction, the New Orders components in the Fed Regional surveys in near ubiquitous retreat, Forward Capex plans continuing to trend lower, and global DM demand still flagging, a sustained positive inflection does not characterize the outlook for investment spending and industrial activity over the nearer-term.


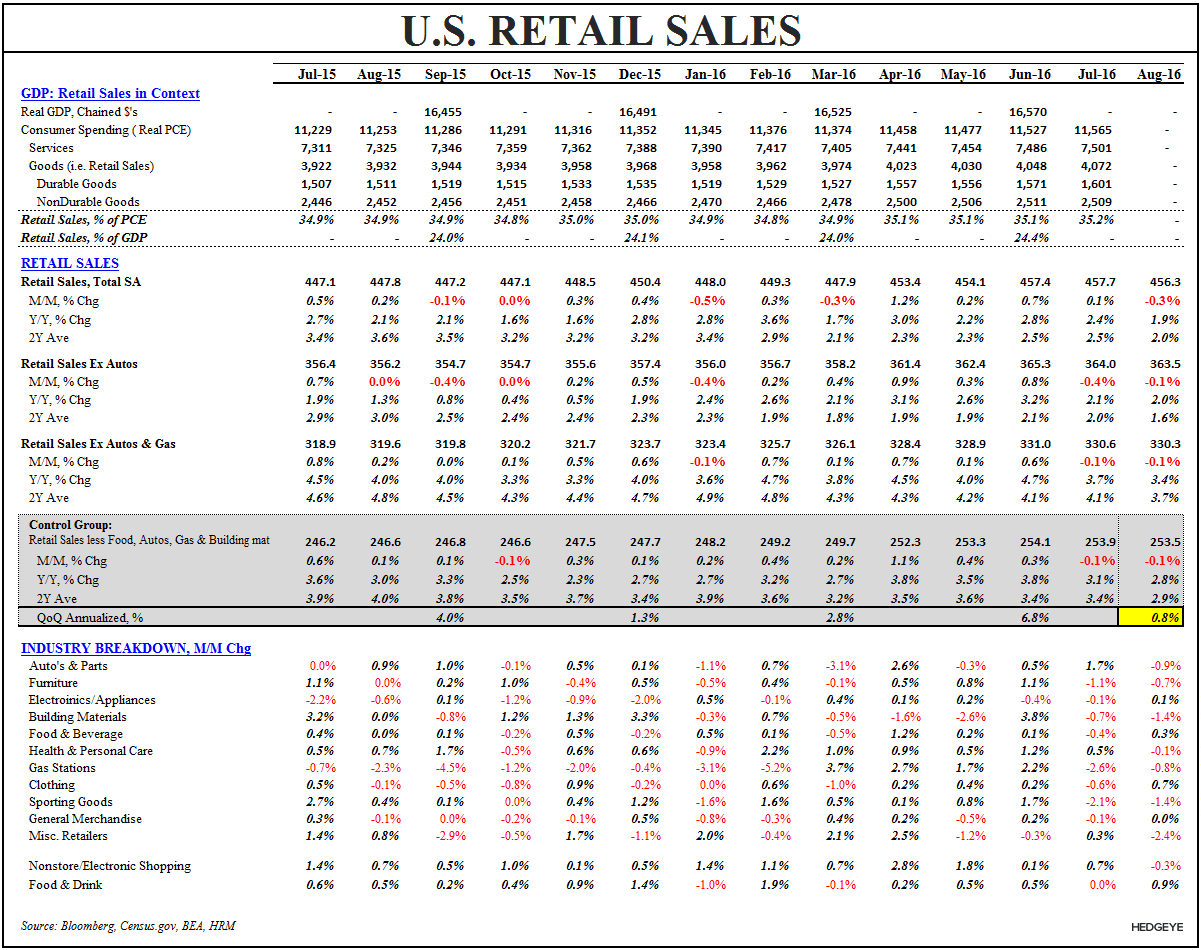
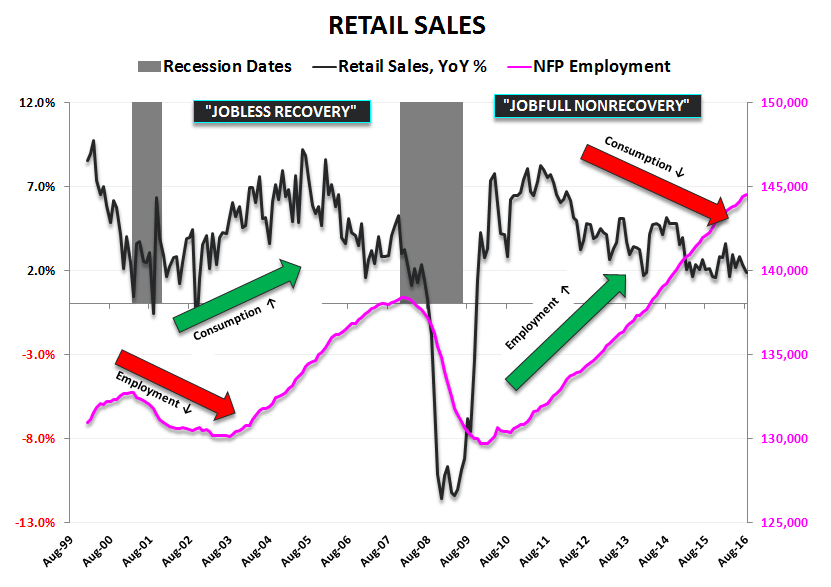
Retail Sales | No Good(s): Consumption Spending continues to buttress consensus expectations for domestic growth as negative revisions continue to characterize the balance of GDP expenditure types. Goods spending (i.e. Retail Sales)- which represents ~35% of PCE and ~25% of GDP - failed to cooperate for a 2nd month in 3Q.
Headline Retail Sales fell -0.3% MoM against positively revised July estimates (July revised +10 bps to +0.1% from +0.0%) with YoY growth slowing to a 5-month low at +1.9% YoY. The headline weakness was not unexpected as auto sales represent ~20% of total and unit sales were down -5% MoM in August. Ex-Autos, however, the trend was similar.
The Retail Sales Control Group (GDP input) declined for a second month, falling -0.1% sequentially while decelerating -30 bps to +2.8% YoY. On a QoQ annualized basis, sales are currently tracking at just +0.8%. This is in sharp contrast to the 2Q trend where goods consumption growth was tracking +6.1% QoQ after 2 months of data. Comparatively healthier growth in Services Consumption (~65% of Household Spending) helped support total PCE growth in July and will need to hold in to avoid a meaningful deceleration in consumer spending growth.
For August, the takeaways are as trivial as the data reporting:
- We are going against the hardest consumption comp of the cycle in 3Q and harder comps and slowing growth do not a positive second derivative make.
- Growth estimates will get a downward revision following this morning’s data.


Christian B. Drake
@HedgeyeUSA
