Following on a note from a mid-August (Re-Visiting Volaility's Assymetry), with the exception of volatility being bid up on front month contracts (Think VIX), a number of volatility and stress indices across asset classes continue to be pushed to new lows.
Whatever your view hopefully the following sentiment gauges of contract positioning, short-interest, volatility expectations, and stress indices offer a refreshing perspective – most of them are important behavioral additives to the quantitative risk management process which objectively signals a NASDAQ and S&P in a BULLISH TREND set-up currently. As we mentioned this morning through various airwaves, “bad” is a “good” #growthslowing allocation theme which is our preferred way to position for the current chop.
Ping us back with any comments or questions – We’re happy to look into anything in more detail.
Key Highlights:
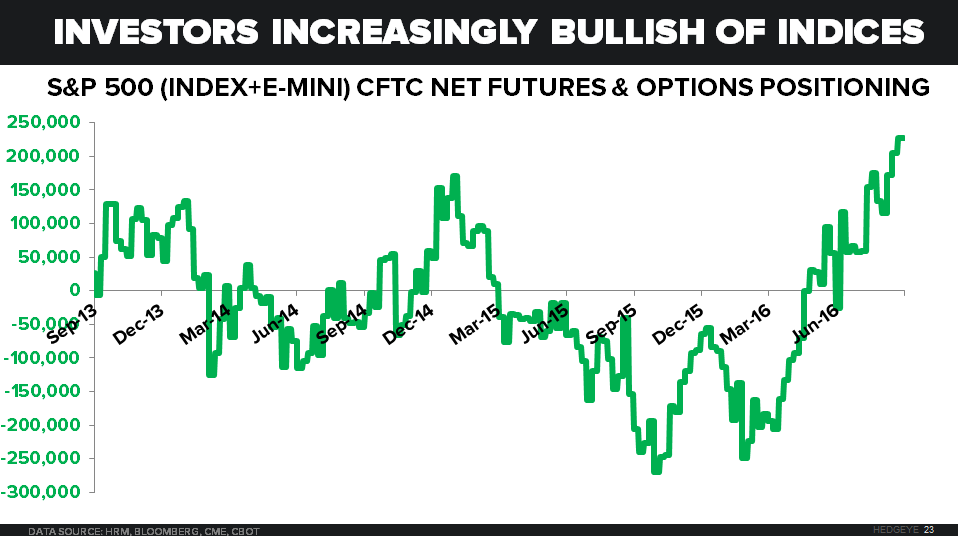
- Consensus derivative positioning in U.S. equity indices continues making new YTD highs in net long positioning (longest since May 2013 in the S&P)
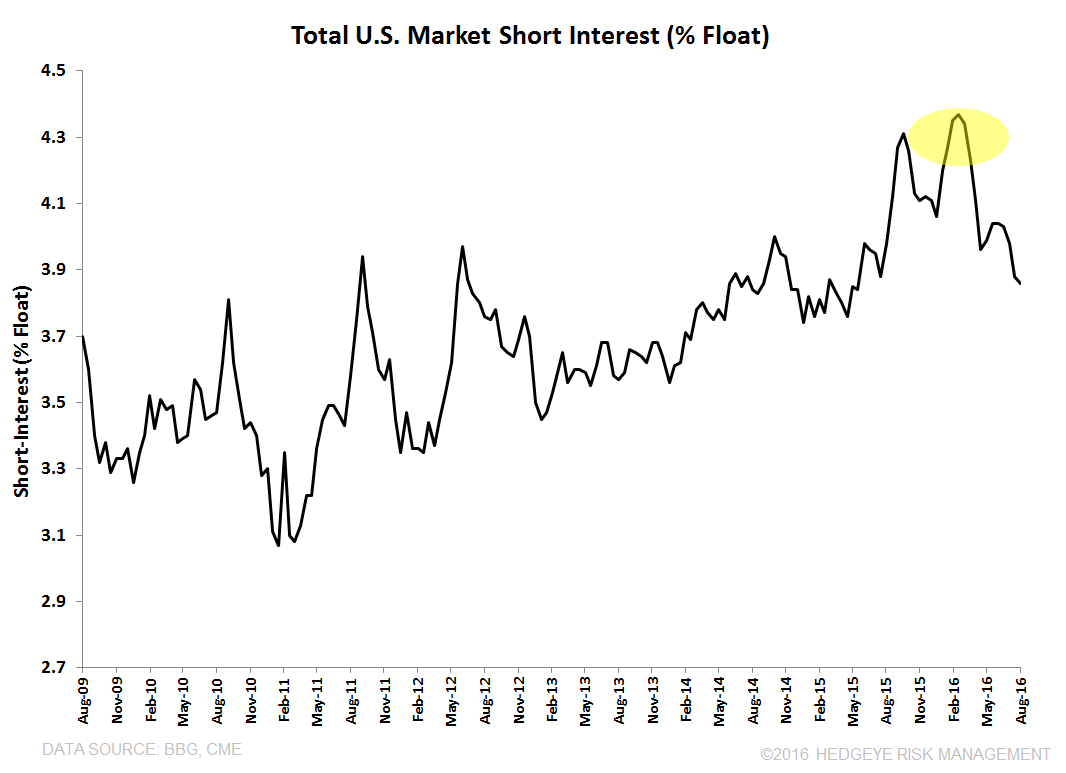
- Against increasingly bullish index positioning in derivative markets, total U.S. market short-interest continues to get cut across sectors
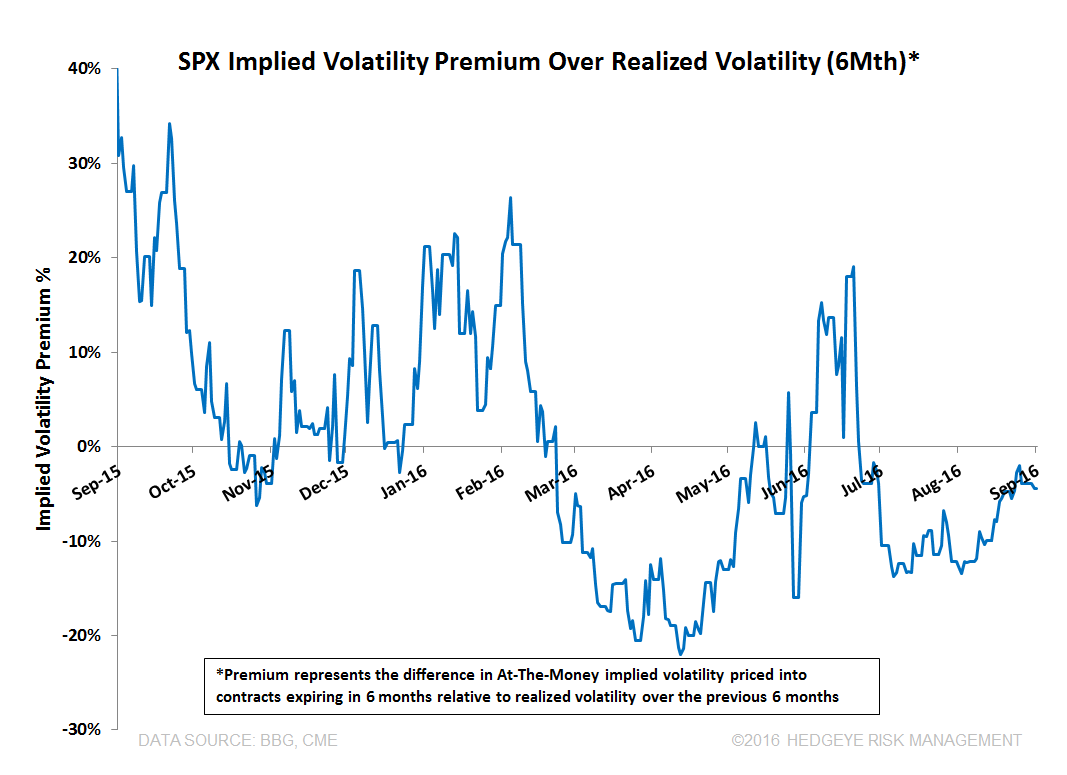
- The VIX has priced in slightly higher front month volatility expectations from the Mid-August lows, but when you look out passed front month pricing, volatility expectations remain low by historical standards through the balance of the year. This is evidenced by S&P index at-the-money implied volatility outright and a more bullish skew across a number of metrics
- Realized trading ranges remain near the cycle lows which we show 1) hasn’t ever lasted; 2) has taken implied volatility premiums with it when looking beyond near term expectations (the VIX and bombed out index strikes on front month)
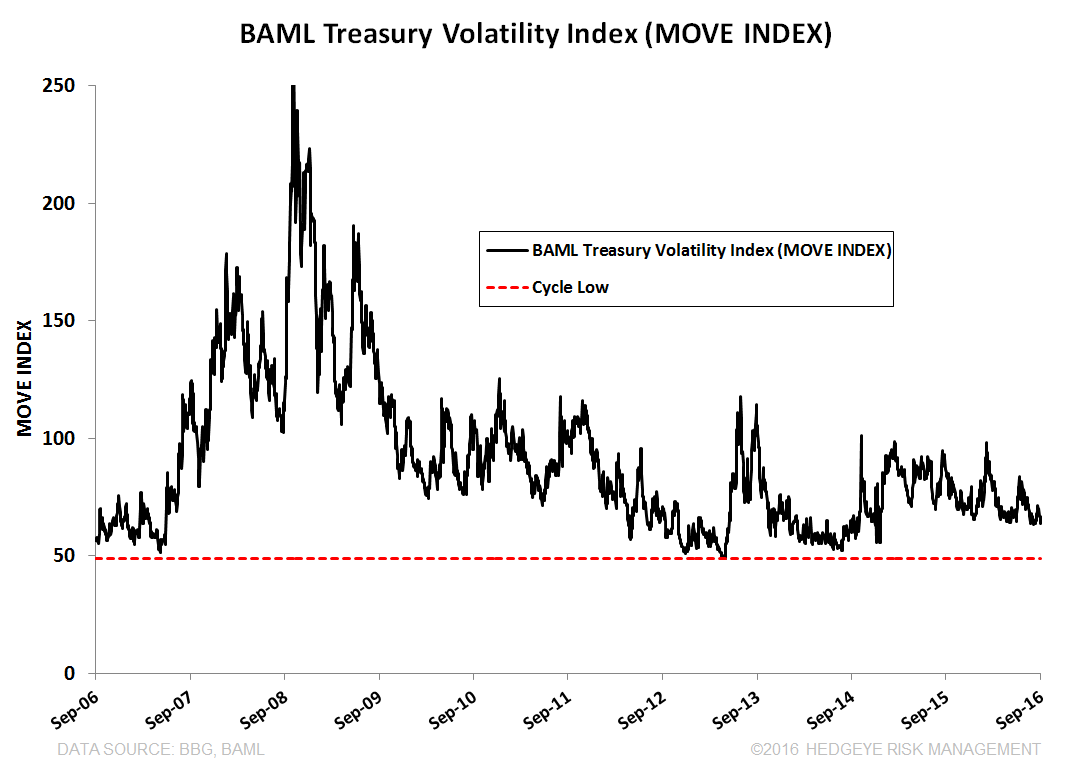
- Following equity volatility, the treasury volatility index (MOVE Index) and the BAML global financial stress index (GFSI Index) continue making new YTD lows
----------
1) Consensus derivative positioning in U.S. equity indices continues putting in new YTD highs
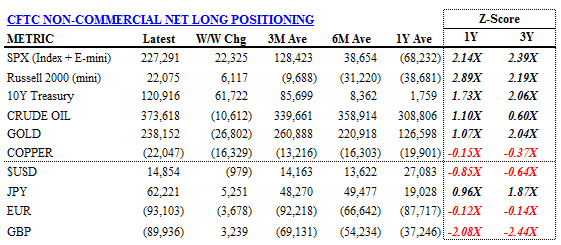
- Net futures and options positioning in the S&P 500 (aggregate of index+e-mini contracts) reported to the CFTC for non-commercial reporters is at its longest point of the year and the longest since May 2013. This equates to +2.1x and +2.4x on a TTM and 3Yr z-score basis respectively
- Net positioning in RUSSELL 2000 Mini contracts is also at its longest positioning of the year (longest since June 2013) which equates to +2.9x and +2.2x on a TTM and 3Yr z-score basis
- Net positioning in treasuries, crude oil, and gold is also extended >1x on a TTM z-score basis

2) Against increasingly bullish index positioning in derivative markets, total U.S. market short-interest continues to get cut across sectors
- A longer-term view of total U.S. market short interest shows that short interest as a % of total float is still above its cycle average;
- But, total market short interest has been cut 12% from the end of February which was not coincidentally right after equity markets put in 2016 lows
- The largest trimming of short interest over the last month has come in Materials (-8.1%), Consumer Staples (-6.1%), Industrials (-5.6%), and Health Care (-5.3%)

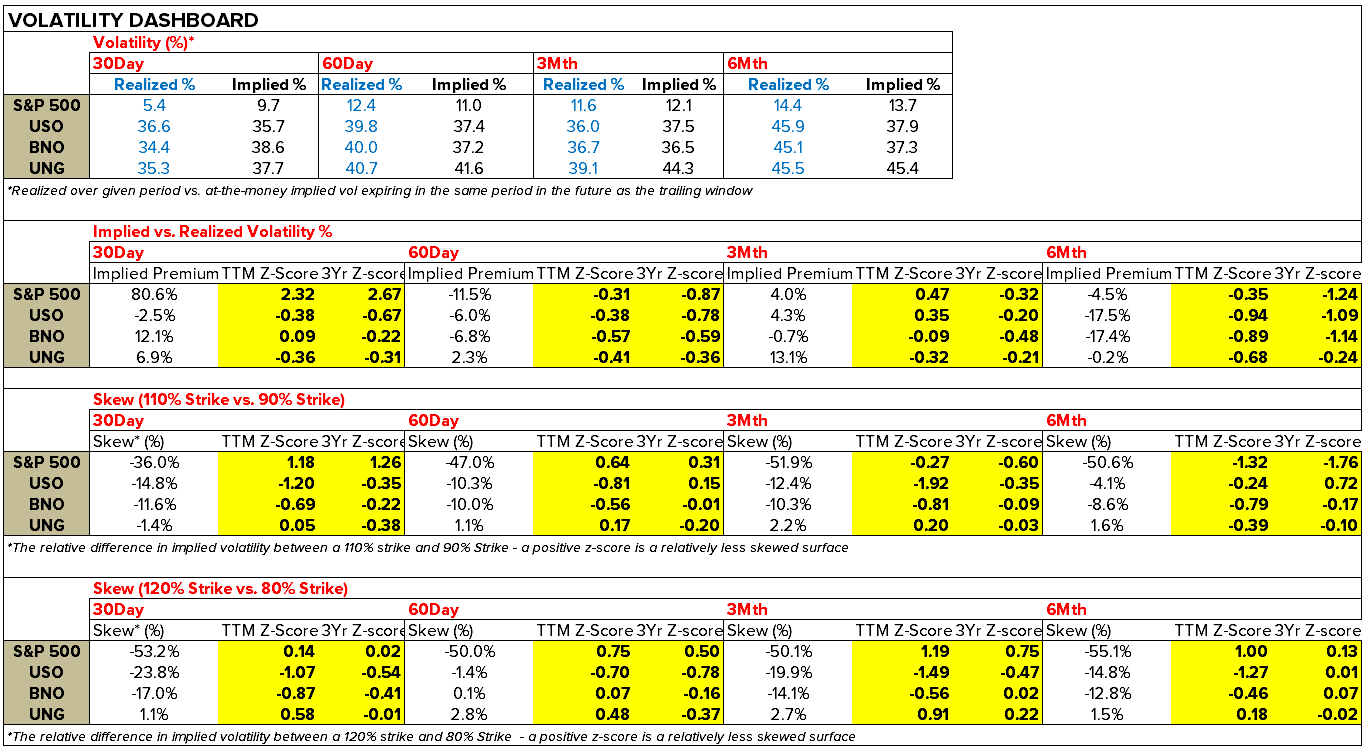
3) The VIX has priced in slightly higher front month volatility expectations from the Mid-August lows, but when you look out passed front month pricing, volatility expectations remain low by historical standards throughout the balance of the year. This is evidenced by S&P index at-the-money implied volatility outright and a more bullish skew across a number of metrics
*Note* To the extent you want to dig into the table below we are showing realized volatility over different durations compared to implied volatility on a go forward basis in the top two sections and relative skew (upside strike vs. downside strike) in the bottom two sections. The table is busy, so we’ll try to sum it up with bullets:
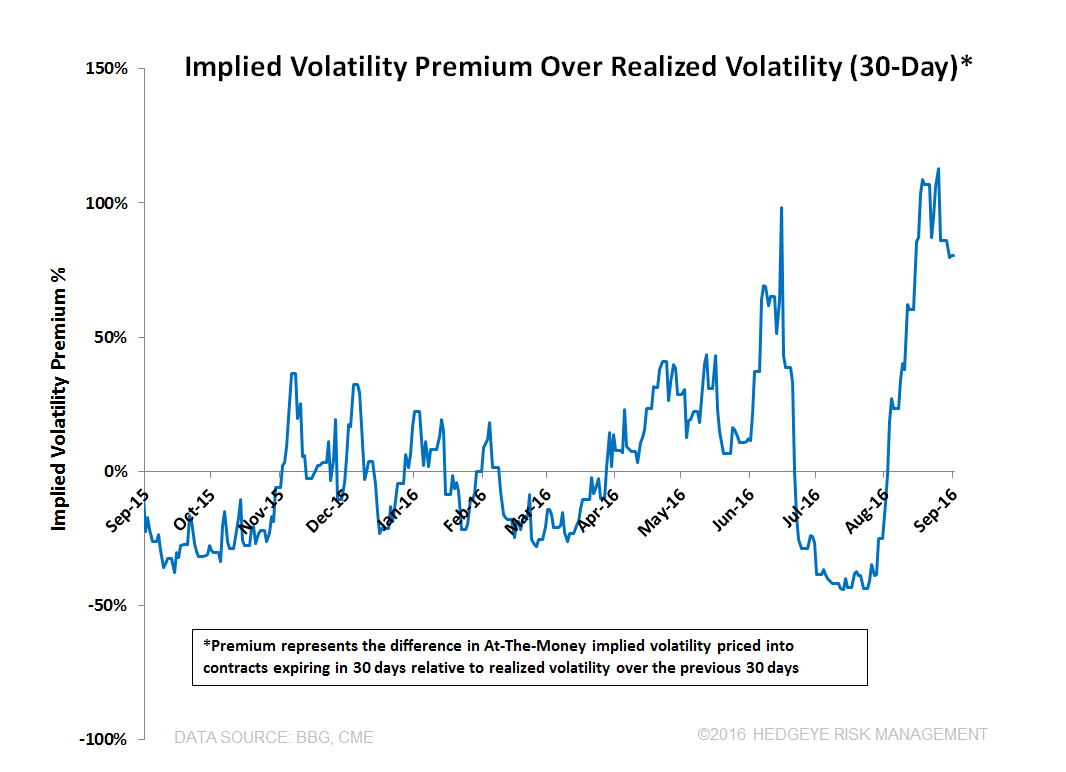
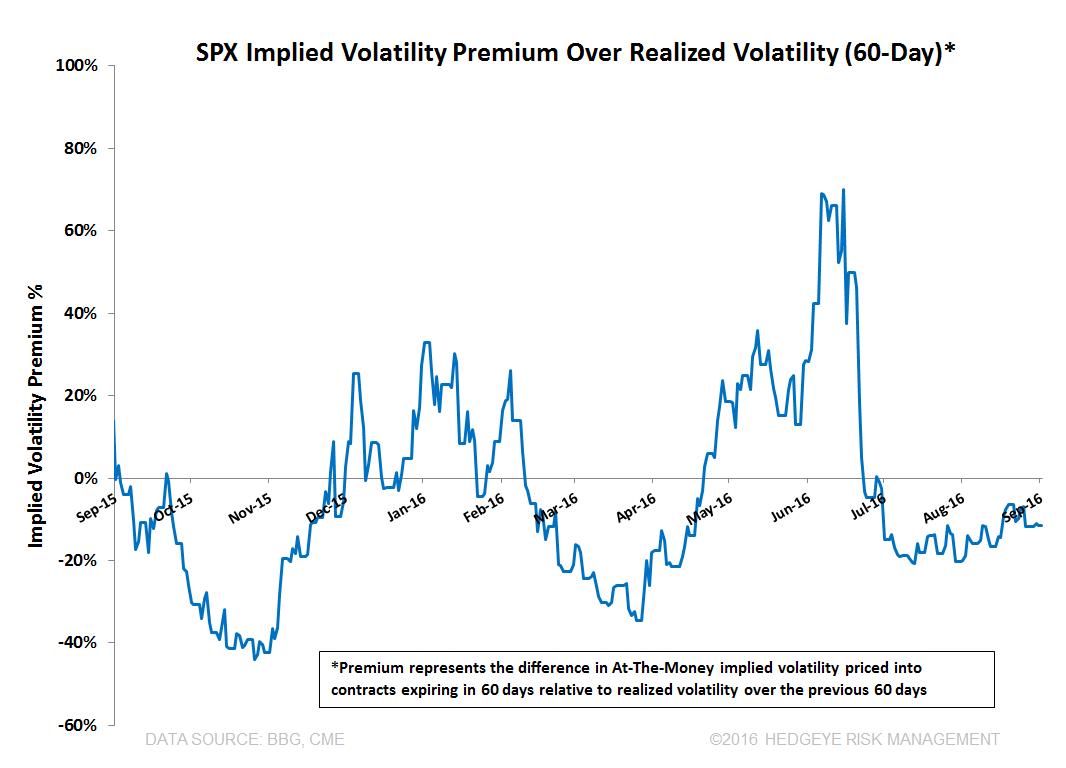
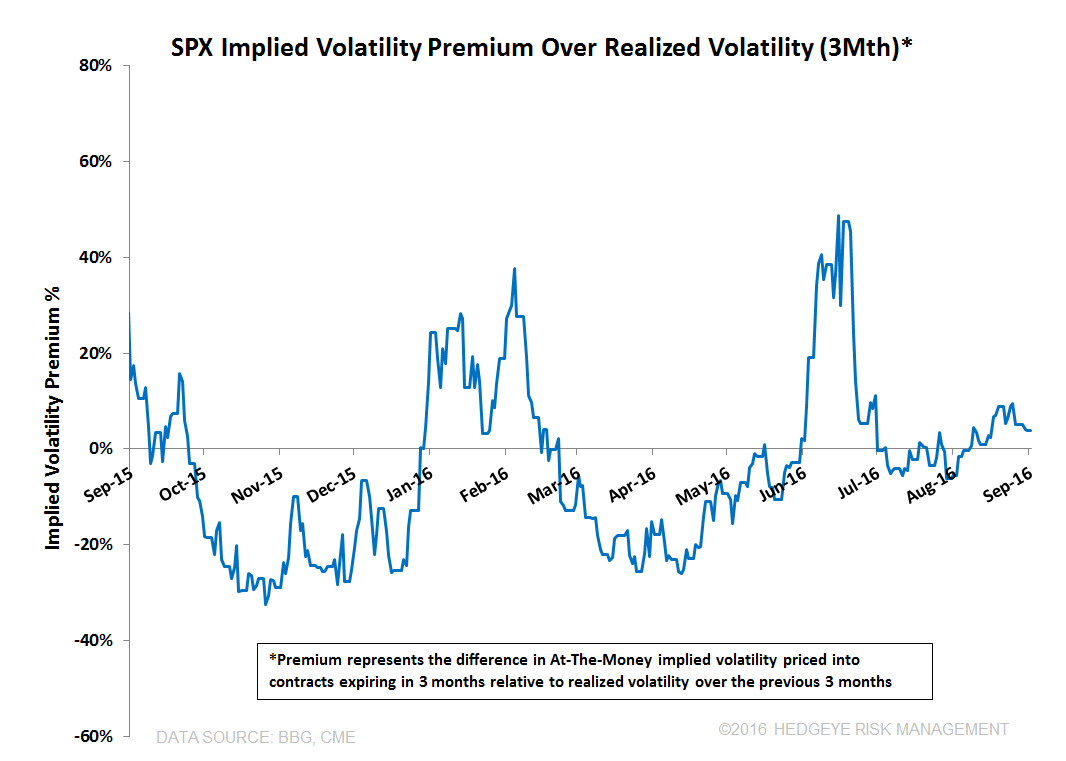
- Front month implied volatility (30 days to expiration) may be trading at a relatively large premium to realized 30D vol. (which is at a cycle low currently), but looking out passed front month and short-term expectations, volatility expectations for the rest of the year are just as near current realized volatility levels, or even lower – the expectation for continued tight trading ranges for 2016 is priced into markets- If you don’t want to look at the table, look at the 60D/3M/6M charts relative to the 30D chart – Realized vol. has come in and brought implied volatility premiums down with it
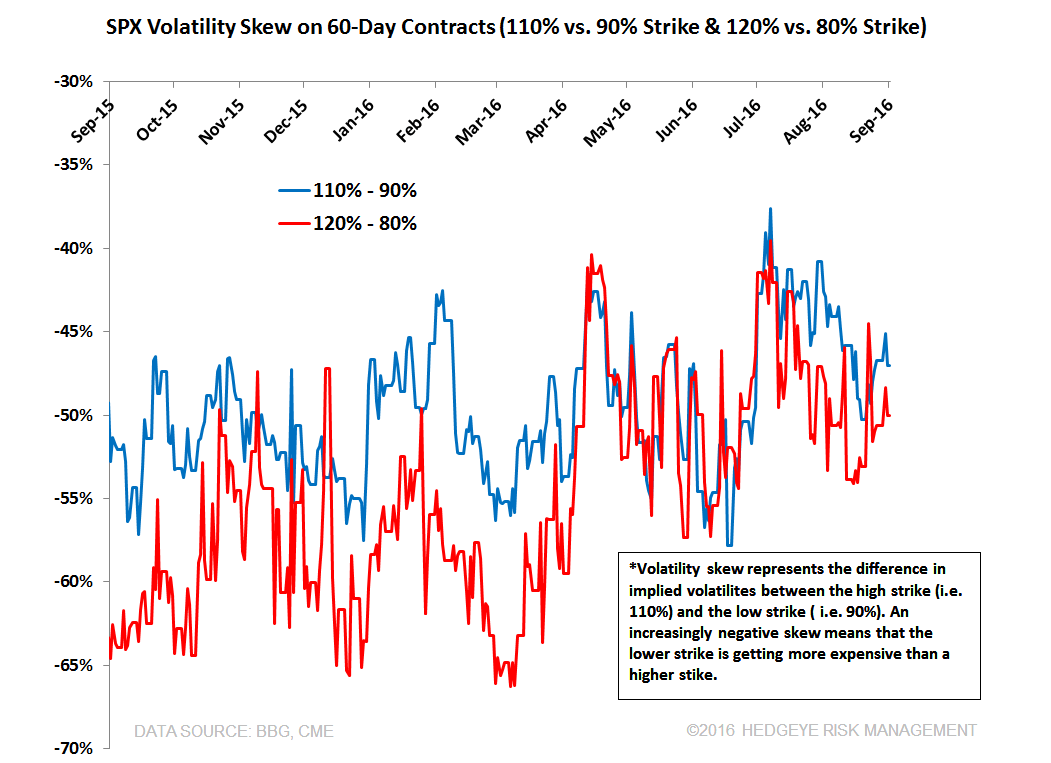
- Although not in a straight-line, skew has moved increasingly bullish throughout the year. The last two charts compare the implied volatilities of upside strikes vs. downside strikes. A positive sloping line indicates that downside strikes relative to upside strikes are becoming less expensive in volatility terms – we doubt it’s a coincidence from a sentiment standpoint that skew was most lopsided right after equity markets put in their Feb lows, just like contract positioning and short-interest.


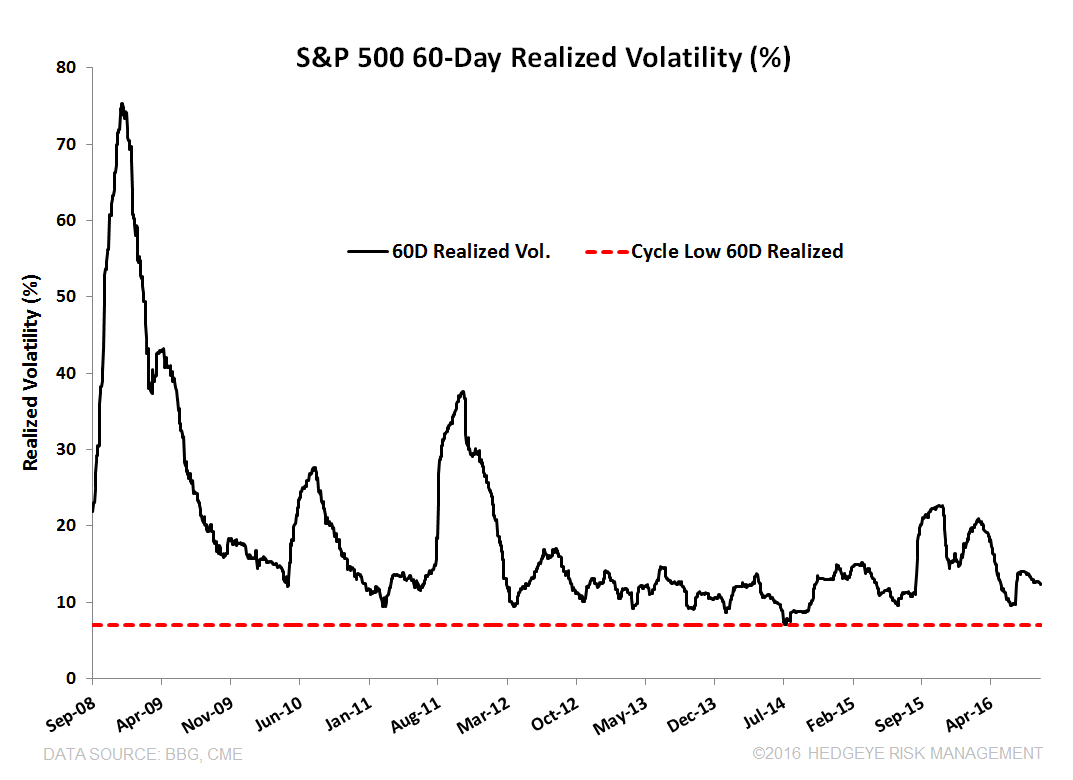
4) Realized trading ranges remain near the cycle lows which we show 1) hasn’t ever lasted; 2) has taken implied volatility premiums with it when you look passed near term expectations (the VIX and bombed out index puts on front month)
- The simple and most important takeaway from the table is that realized volatility has rarely remained as low as it’s been recently for any extended period of time
- In the table below, an observation is triggered when volatility moves below 6% for 20 and 30 days and below 5% for a 10-day periods. The ensuing changes in realized volatility are shown over different durations. There aren't many precedents for realized volatility at current levels, and the past is not a predictor of the future, but the analysis provides some perspective nonetheless


5) With equity volatility, the treasury volatility index (MOVE Index) and the BAML global financial stress index (GFSI Index) continue making new YTD lows