This quarter had all the makings of a bad cocktail. The garnish was pretty – demonstrated by the 17% headline EPS beat, 12% sequential improvement in the EPS growth rate, and maintained guidance for the year. But the event itself lacked any substance that would shake us from our bear case. Heck, the comp itself was just shy of toxic, and at -9% in constant currency is good for the second worst comp in all of retail behind only Stage Stores – consistent with what we saw in 1Q16 when TIF ranked 2nd on the list of worst performing retailers behind Lumber Liquidators. That’s not an enviable list.
We get that the stock is hated, but we still think there is a lot of hope embedded in this name at current levels. Here’s what’s currently assumed in Street expectations and our pushback…
- Comps will inflect to positive in 4Q and beyond. Comps do get sequentially easier throughout the year, but if you’re looking for a way to play the ‘easy weather compares’ this isn’t the story. That is unless TIF has a Flagship in Arendelle that we're not aware of (Arendelle = the magical land of Frozen fame). Plus, the macro backdrop from a demand perspective continues to erode – that’s confirmed by every metric we track including US Luxury Spend, high-end watch exports, and foreign tourism flow.
- Margins will stabilize. TIF has some positive benefits working in its favor on the gross margin side from input costs, and the company won’t compete on price keeping merch margins relatively stable. That’s the positive. On the negative side, the company pulled the SG&A parachute this quarter and continues to operate in the status quo. That means no tangible investment plan to invest in all the right places to make the ‘Little Blue Box’ cool again in the eyes of the core consumer. The lack of that investment, we think will translate to a sluggish top-line in the near and long-term and margin deleverage.
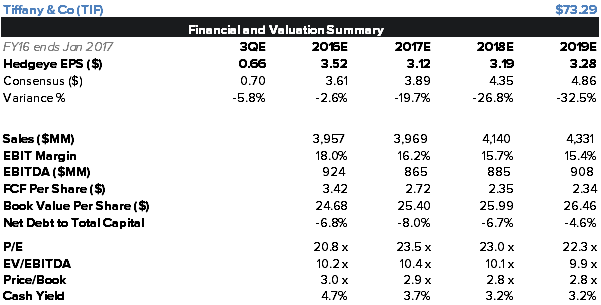
That gets us to a -2% EPS CAGR over the next three years vs. the street at 10%. Even if we’re wrong, and the Street’s numbers prove out, we think you’re looking at a best case 20x multiple on $4 bucks next year, good for 10% upside. If this call plays out the way that way think it will, we’re looking at 40% downside or stock in the mid-40s (mid-teens multiple on $3.20 in EPS). We’d short on strength.
Additional Callouts From The Quarter
Comps Weak, US Slowing
Comps missed for the 4th straight quarter coming in about 100bps below the street. As expected, soft demand and macro headwinds continue to pressure the US as the Americas C$ comp slowed on a 2 year basis, now running at a negative MSD rate. We expect comps to continue to be soft as the issues of tourist traffic and luxury demand, which we highlighted in our previous note (below), show no signs of abating.

Gross Margins Beat as Expected
About 1/3 of the EPS beat came from gross margin outperformance, though they were actually in line with our expectations. TIF continues to benefit from lower product costs as commodity price drops flow to the P&L from inventory, and TIF is seeing a bump from international price increases last year which were implemented in order to offset Fx presssure. Product costs should continue to be a tailwind with cheaper diamond prices hitting the income statement in 2017, however in the back half TIF will lap last year’s price increases meaning gross margin expansion should be much more muted than 1H.
Pulling SG&A
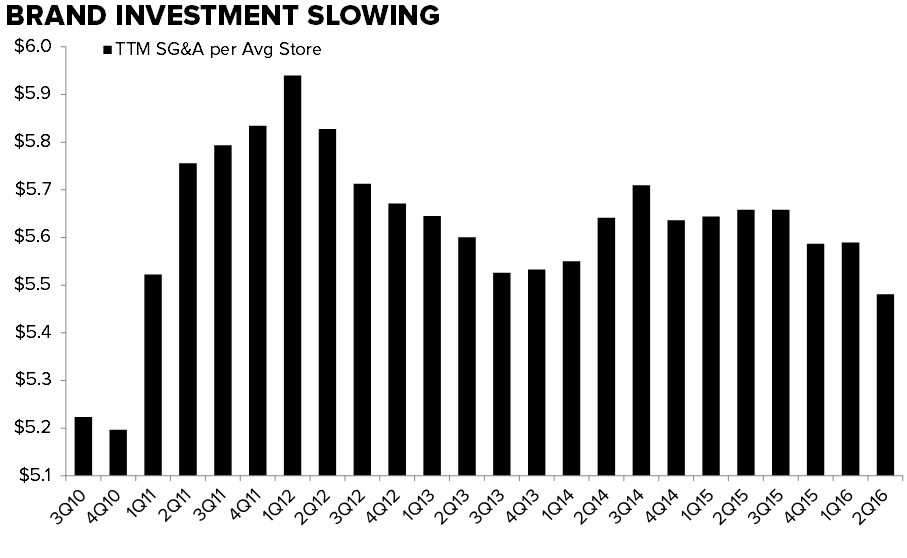
2/3 of the 17% headline EPS came from lower SG&A spend in the quarter, as TTM SG&A per store hit the lowest levels we have seen in over 5 years. Lower investment today = lower demand in the future. If TIF wants to meaningfully accelerate the top line it needs a significant capital spending plan to reinvigorate the brand, which would ultimately mean a reset to margins and lower returns on capital.
Look to the near-term, FX is inflecting to an SG&A headwind in the back half while also working against tough compares, so even if TIF continues to underspend, we expect SG&A growth to meaningfully accelerate into year end.
Below is our prior note from 8/24/16
We’re comfortable with the TIF short headed into earnings on Thursday. To be clear, we wouldn’t press it, as the name has a lot of the style factors that we tend not to like into a newsy event. Namely peaky short interest at 13% of the float, hittable expectations with the street looking for a -8% comp deleveraging into -16% earnings growth, and management’s penchant for beating low-bar guidance. Despite 2016 EPS expectations coming down by $1.50 to $3.59 the company has a 67% batting average when it comes to manufacturing beats.
Over a slightly longer duration, we think expectations for the current year still need to come down by at least another 5%, as all the work we’ve done suggests that the tourism/luxury headwind and simply weak demand for TIF products hasn’t improved – at all, really – which is an absolute must if the company wants to hit the positive comp bogey currently embedded in street models for 4Q. Then we fast forward to 2017, and we’re looking at $3 in earnings power vs. the street close to $4.
If we’re right on the model, we think that $3 in earnings power will translate to a mid-teens earnings multiple which gets us to a stock in the low $40s good for 35%-40% downside from current levels. If we’re wrong and TIF recognizes the benefit from 2yrs of easy compares, a better luxury demand equation than we currently see shaping up, and finds some way to become ‘cool’ again with a younger demographic, then we think we are looking at best-case a 20x P/E on $4 in EPS = $80 stock. That’s $11 upside, and $27 down. We like the risk reward on a tail duration, with the macro back-drop not doing TIF any favors.
Additional Considerations:
Luxury Bucket Just Went Negative
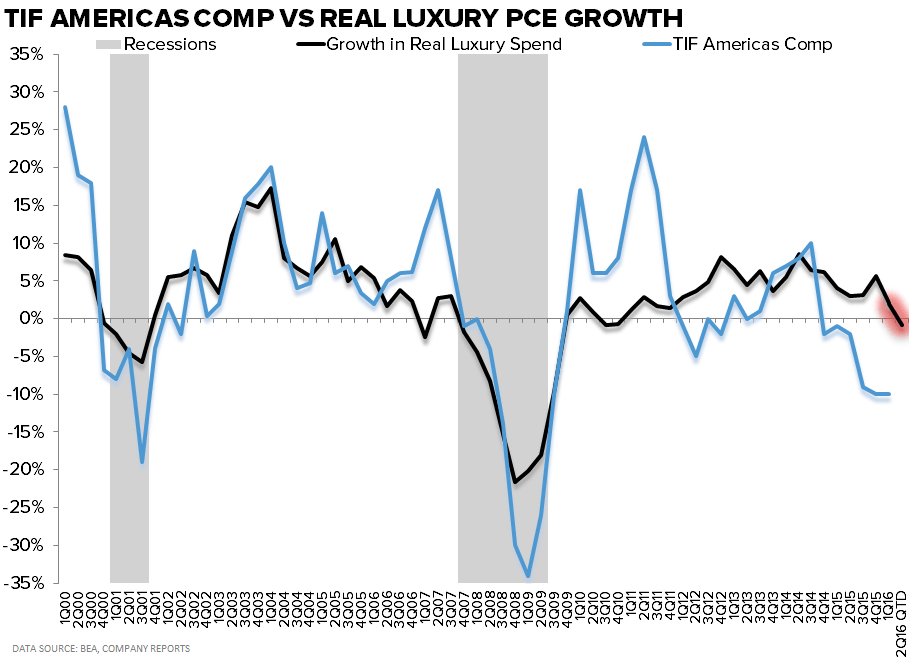
Real luxury spending, as we measure it (Pleasure Vehicles and Watches & Jewelry PCE), went negative in May for the first time in 5 years and the June number continued the downward slide. Historically, comp sales for TIF have generally followed this luxury bucket directionally. But we’ve seen a meaningful bifurcation in the trend starting 18 months ago. We think that speaks to the company’s competitive positioning and general lack of demand for the product offering. With luxury demand headed into negative town, we think it adds an additional kicker to the TIF demand equation.
Swiss Watch Trends Signaling Weakness
The Swiss Watch Exports numbers are the best indicator that we can find to gauge the global demand for luxury items – particularly jewelry. Of course, watches have their very own demand constraints and TIF is underexposed to the category – but we'd argue that the iWatch, FitBit, and other connected fitness wrist wear don't compete with items priced above $3,000. That price range posted a -17% growth rate in 2Q, good for a 550bps deceleration on a 2yr basis.
Looking at the trend in TIF comp sales vs. the global Swiss Watch exports numbers paints a pretty tight correlation between the two metrics. Watch exports slowed significantly in 2Q, while the current comp expectation for Tiffany is looking for a slight inflection.

Tourism Has Not Hit Bottom
When things started to turn south for Tiffany, management quickly pointed to the weak international consumer demand that was inflicting a great deal of hurt to companies with high US tourism exposure. The general sentiment seems to be that the tourism headwind is starting to roll off. However, if we look at the actual trends in international visitation and commentary by companies during this earnings season, we can see that international tourism visitation to the US is hitting new lows at 1.3%. That’s off from 5.2% last year. The punchline is that the tourism headwind isn’t going away anytime soon – during the last notable deflationary period (08/09) visitation slowed from +13% to -7%.

In addition, beyond the slowing US visitation trend is the total spending impact that visits and FX fluctuations have on the spending power of international tourists. The chart below shows the YY change in spending power on a TTM basis. For this analysis, we assumed a value of spending per visit that varied based on where the visitor was traveling from, and adjusted this value based on YY changes in FX rates with the dollar. Spending power remains negative at -2.7%, with the 2 year average hitting new lows. Keep in mind that any discretionary portion of spending is being compressed significantly more. By that we mean, assuming a visitor uses a constant trip budget year over year, the change in currency conversion flows predominantly to the discretionary spend, since the fixed pieces (hotel, ground transport, food, etc) will not get cheaper in USD. Retailers annualized the start of the 2015 FX tourist issues about 6 months ago, but tourist spending power shows no signs of rebounding both in our math nor in retailer commentary. For TIF – who has global exposure, the "easy" tourism compares in the US don’t mean the same thing that it does for a company like M, as we think TIF has benefited from shifting travel patterns in some of its international markets.

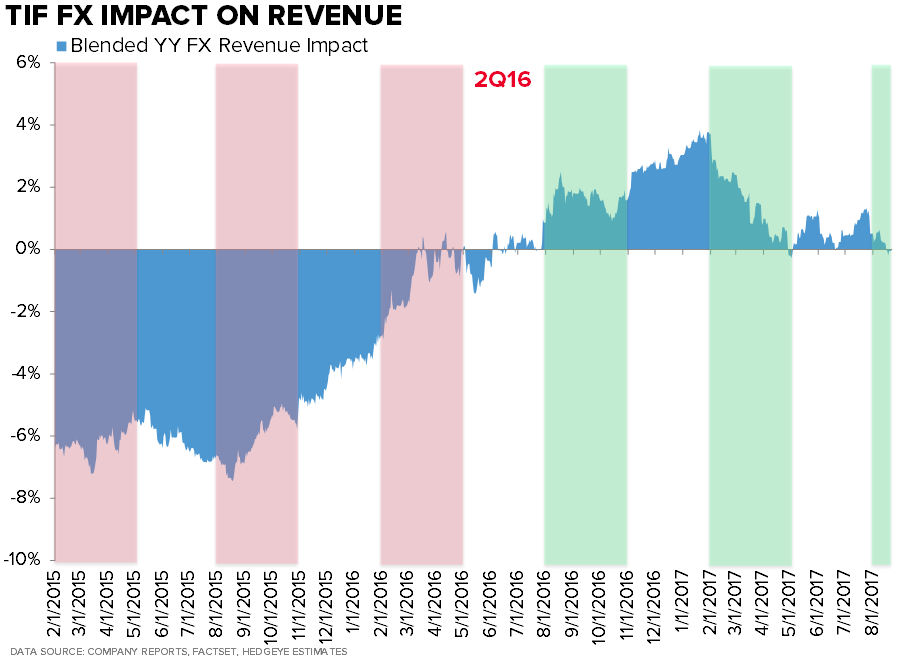
FX Inflecting to Topline Tailwind
FX should be an ever so slight drag on revenue in 2Q. However, on the positive side, after 7 quarters of FX hurting the revenue line, this quarter marked the inflection point where currency could start to aid growth in USD (assuming constant FX rates from now). This is mostly due to the 12% rally in the Japanese Yen over the last 6 months, while the Pound and Yuan continue to be a drag. Yet with C$ comps currently running in the negative high single digit range, a couple point bump from currency will likely not be enough to put reported comps into the black.
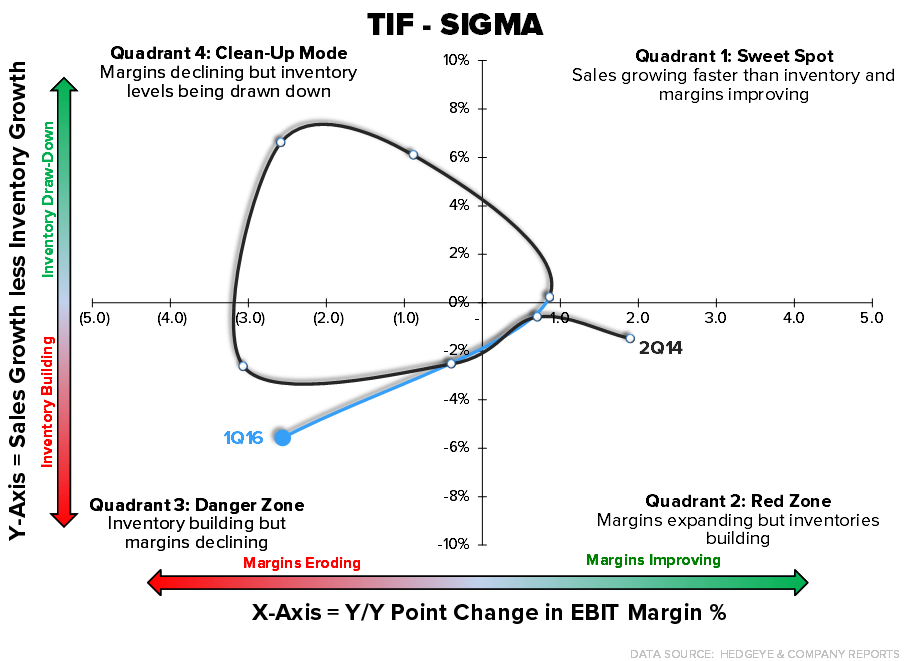
Margins:
TIF had one of the worst SIGMA moves in retail in 1Q, and a bearish set-up for 2Q. For the average retailer, this is very negative for margins, but due to the nature of luxury jewelry production and sales, TIF historically has had no problem holding extra working capital with inventory days at 612 – the highest in all of retail. As a luxury brand Tiffany also does not compete on price to boost the top-line nor will it compete away margin benefits resulting from lower product costs. As cheaper metals continue to flow through to the P&L, we expect gross margins to surprise to the upside. And 2017 margins will continue to see product cost benefits as diamond price decreases start to flow through as well.
Marketing spend was high in 2Q of last year with capital deployed backing Tiffany's "Will You" campaign. Tiffany now gets to lap that so we are expecting SG&A growth to be muted in 2Q. Lastly, since FX is no longer a revenue headwind, so goes the SG&A tailwind that was once as much as a 5% offset to reported SG&A in mid 2015.