

Investment Company Institute Mutual Fund Data and ETF Money Flow:
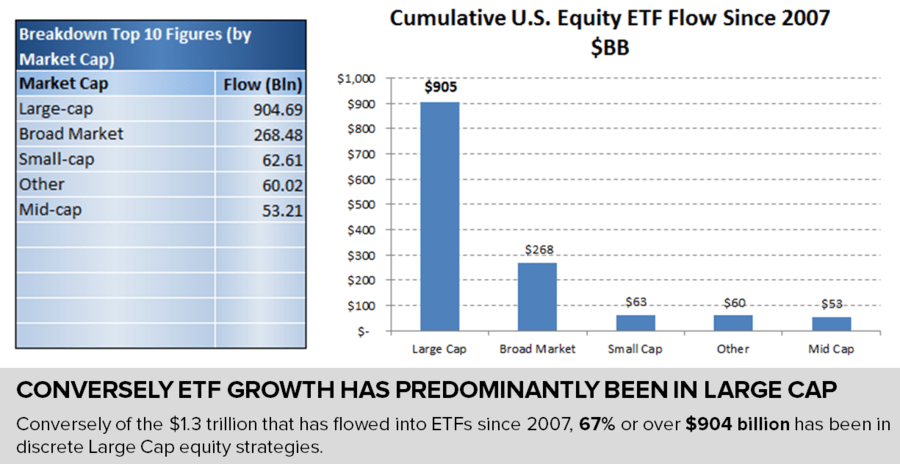
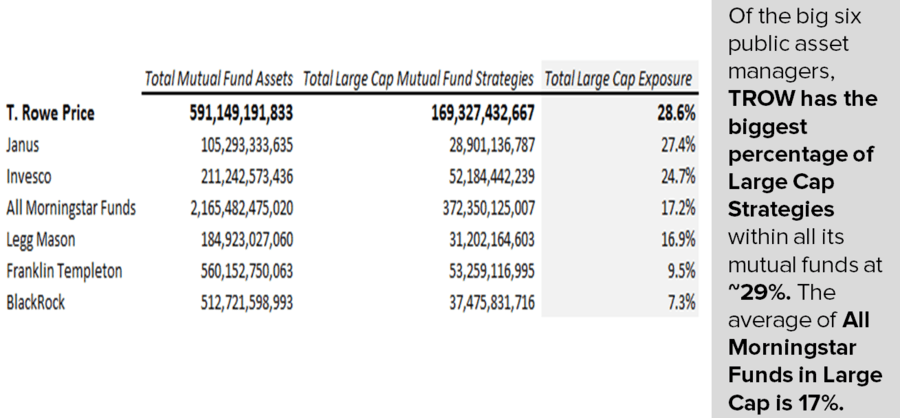
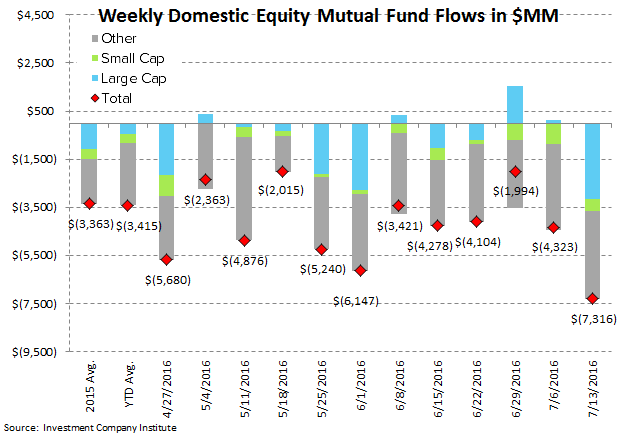
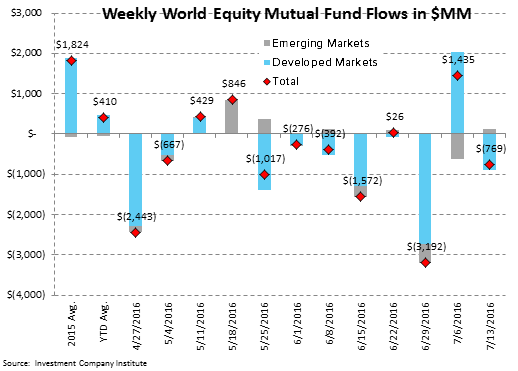
The ongoing shift from the expensive, less liquid, and taxably inefficient mutual fund structure was most evident as although U.S. stocks rose in the 5-day period ending July 13th, investors put through the biggest redemption of 2016 in U.S. active equity mutual funds redeeming-$7.3 billion. International equity mutual funds were also losers giving up -$769 million in the period. Meanwhile, the reallocation to passive products continued with equity ETFs winning their largest inflow of the year with +$15.7 billion in new money last week ($8.4 billion of which went into the broad market SPY). In light of these trends, we maintain our short call on T. Rowe Price (TROW---most recent research HERE), which has the highest percentage of large-cap strategies of the public asset managers (the main category which is moving to passive). We estimate TROW continues to overearn in the current bull market in equities but with a stubbornly high cost structure, operating margins have peaked and are now compressing. We are also cautious near-term for the company's earning's print next Tuesday the 26th.
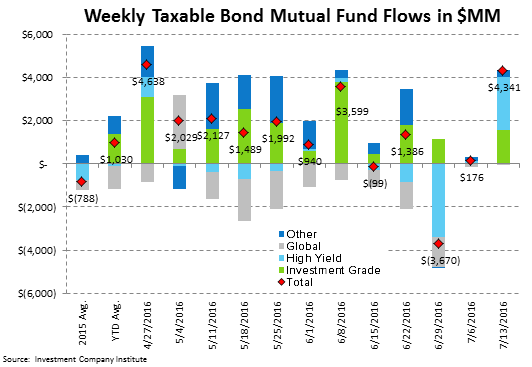
In fixed income, almost all categories experienced inflows last week. Total bond mutual fund flows were +$6.1 billion, and fixed income ETFs took in +$4.7 billion. Only global bond mutual funds lost a small -$8 million. Additionally, investors defensively shored up +$19 billion in money market funds.
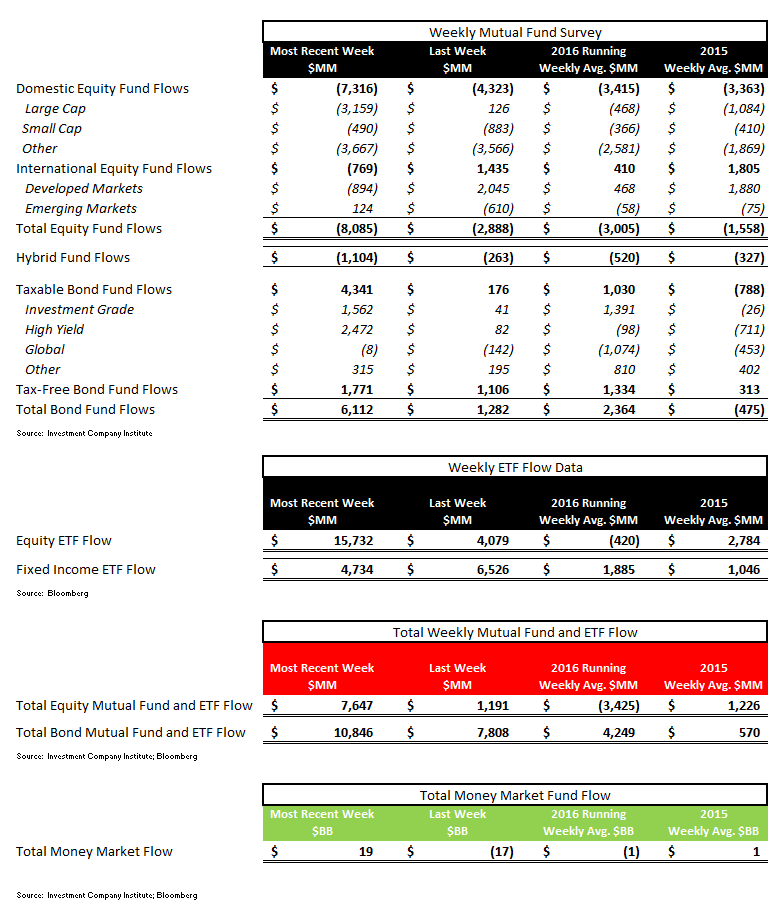
In the most recent 5-day period ending July 13th, total equity mutual funds put up net outflows of -$8.1 billion, trailing the year-to-date weekly average outflow of -$3.0 billion and the 2015 average outflow of -$1.6 billion.
Fixed income mutual funds put up net inflows of +$6.1 billion, outpacing the year-to-date weekly average inflow of +$2.4 billion and the 2015 average outflow of -$475 million.
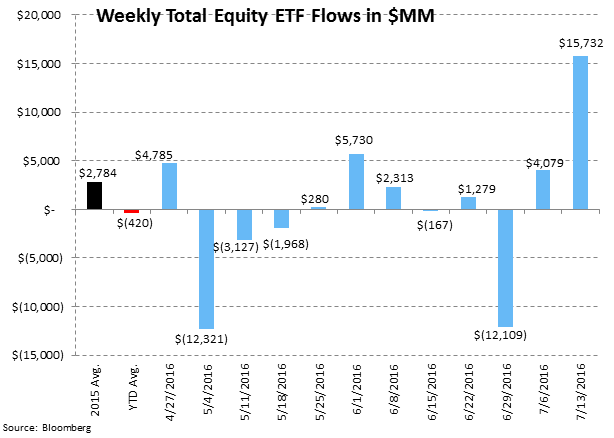
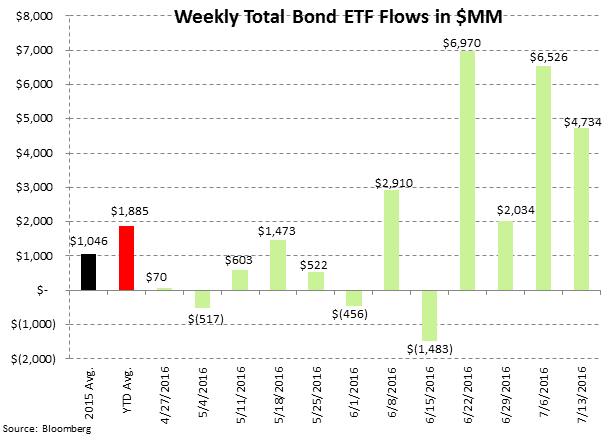
Equity ETFs had net subscriptions of +$15.7 billion, outpacing the year-to-date weekly average outflow of -$420 million and the 2015 average inflow of +$2.8 billion. Fixed income ETFs had net inflows of +$4.7 billion, outpacing the year-to-date weekly average inflow of +$1.9 billion and the 2015 average inflow of +$1.0 billion.
Mutual fund flow data is collected weekly from the Investment Company Institute (ICI) and represents a survey of 95% of the investment management industry's mutual fund assets. Mutual fund data largely reflects the actions of retail investors. Exchange traded fund (ETF) information is extracted from Bloomberg and is matched to the same weekly reporting schedule as the ICI mutual fund data. According to industry leader Blackrock (BLK), U.S. ETF participation is 60% institutional investors and 40% retail investors.
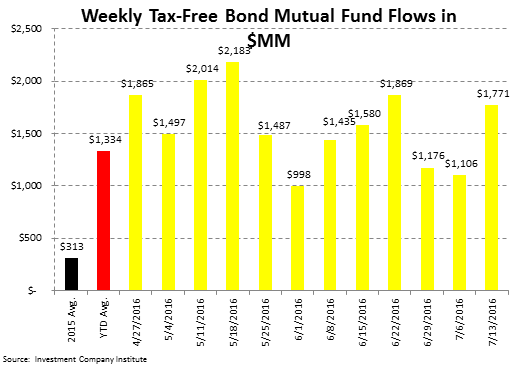
Most Recent 12 Week Flow in Millions by Mutual Fund Product: Chart data is the most recent 12 weeks from the ICI mutual fund survey and includes the weekly average for 2015 and the weekly year-to-date average for 2016:

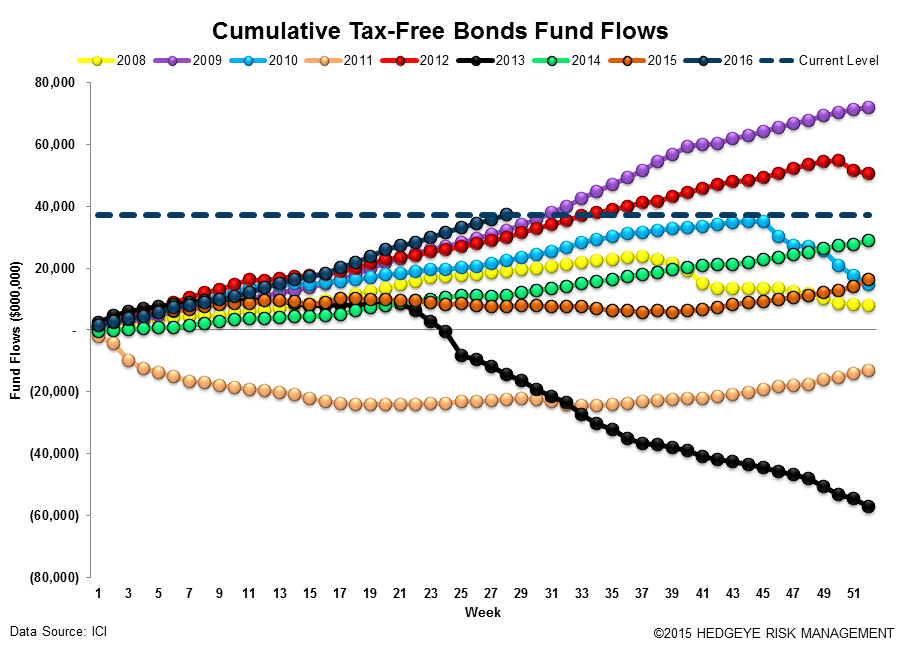
Cumulative Annual Flow in Millions by Mutual Fund Product: Chart data is the cumulative fund flow from the ICI mutual fund survey for each year starting with 2008.


Most Recent 12 Week Flow within Equity and Fixed Income Exchange Traded Funds: Chart data is the most recent 12 weeks from Bloomberg's ETF database (matched to the Wednesday to Wednesday reporting format of the ICI), the weekly average for 2015, and the weekly year-to-date average for 2016. In the third table are the results of the weekly flows into and out of the major market and sector SPDRs:
Sector and Asset Class Weekly ETF and Year-to-Date Results: In sector SPDR callouts, investors contributed +$8.4 billion or +4% to the broad market SPY while withdrawing -$500 million or -6% from the utilities XLU.

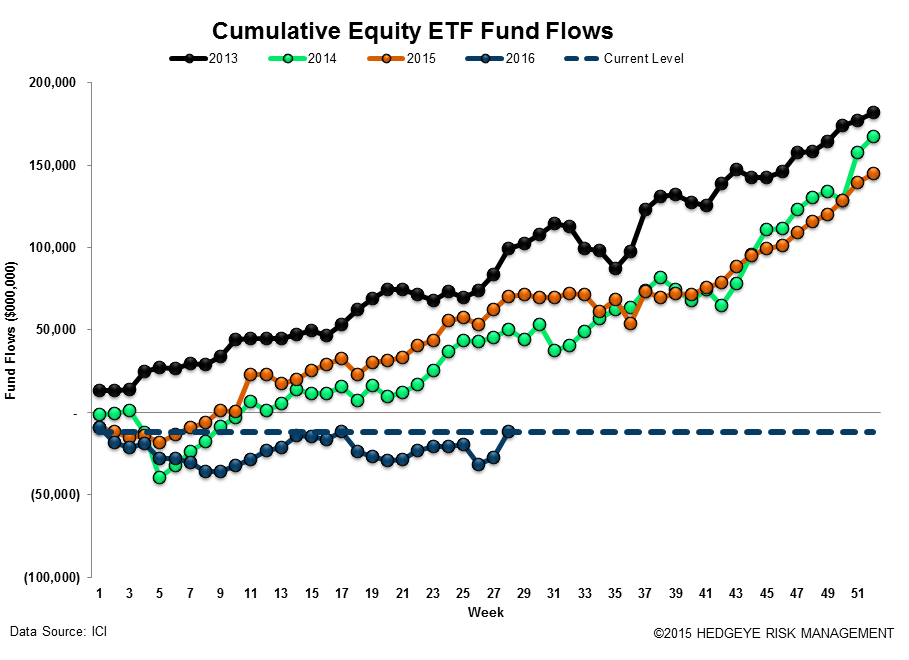
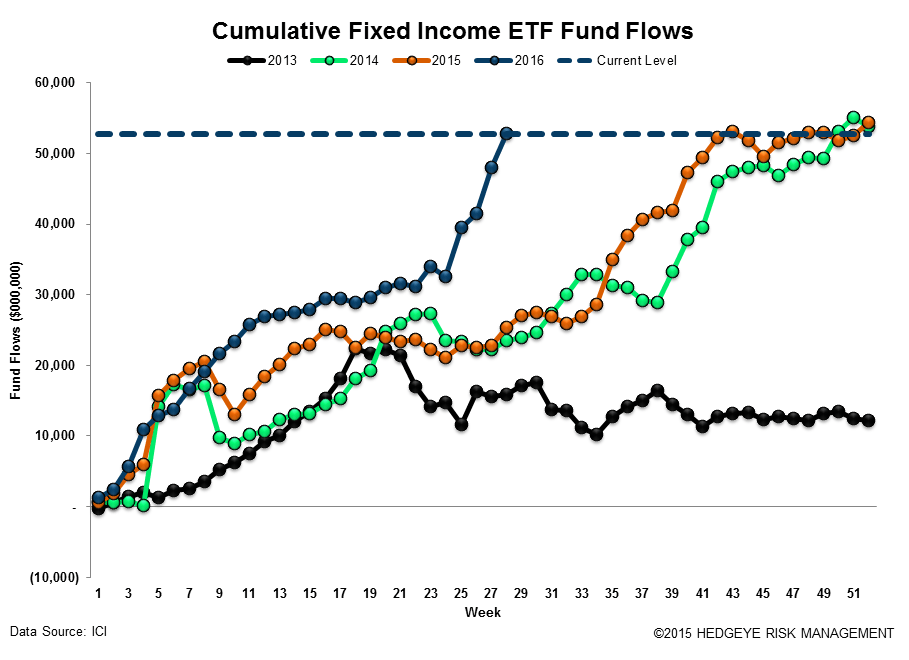
Cumulative Annual Flow in Millions within Equity and Fixed Income Exchange Traded Funds: Chart data is the cumulative fund flow from Bloomberg's ETF database for each year starting with 2013.
Net Results:
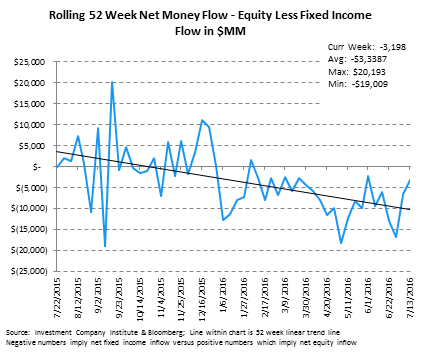
The net of total equity mutual fund and ETF flows against total bond mutual fund and ETF flows totaled a negative -$3.2 billion spread for the week (+$7.6 billion of total equity inflow net of the +$10.8 billion inflow to fixed income; positive numbers imply greater money flow to stocks; negative numbers imply greater money flow to bonds). The 52-week moving average is -$3.4 billion (negative numbers imply more positive money flow to bonds for the week) with a 52-week high of +$20.2 billion (more positive money flow to equities) and a 52-week low of -$19.0 billion (negative numbers imply more positive money flow to bonds for the week.)
Exposures: The weekly data herein is important for the public asset managers with trends in mutual funds and ETFs impacting the companies with the following estimated revenue impact:

Jonathan Casteleyn, CFA, CMT
Joshua Steiner, CFA
Patrick Staudt, CFA
