

Our Hedgeye Housing Compendium table (below) aspires to present the state of the housing market in a visually-friendly format that takes about 30 seconds to consume.

Today’s Focus: April Case-Shiller HPI
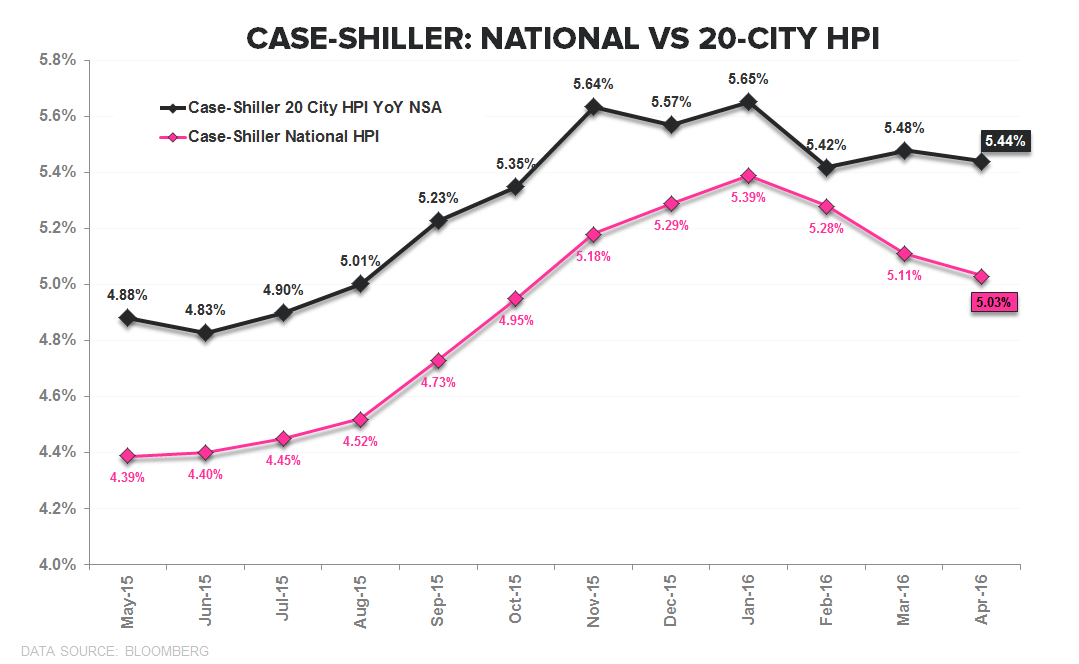
The Data: Case-Shiller HPI data for April released this morning – which represents average price data over the February-April period – extended the trend of flat-to-slowing price growth as the 20-City series was largely flat sequentially while the National series decelerated for a 3rd consecutive month, slowing -10bps sequentially to +5.0% YoY. The negative 2nd derivative trend in the Nation Series – where growth is now -30bps of the Jan ’16 peak rate-of-change – accords with the FHFA HPI series for April released last week which showed price growth decelerating -30bps sequentially to +5.9% YoY.
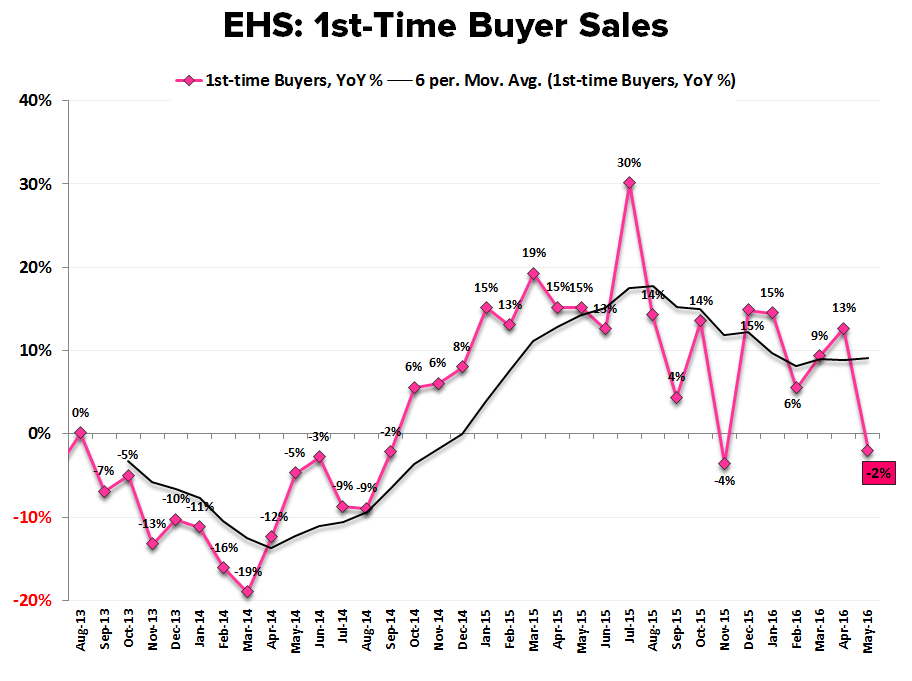
Low End Support: Notably, the Case Shiller Price tier data show that the low end – while slowing modestly the last few months – continues to buttress price growth in the composite. Price growth across both the Mid and High Tiers began to slow ~3Q15 as the pace of inventory decline bottomed (see charts 5/6 below). From here, it will be interesting to observe price action at the entry level as growth in 1st time buyer demand continues to slow at the margin. According to the latest NAR data, transaction volume growth for first-time buyers was actually negative (-2% YoY) in May.
HPI Tug-O-War | Advantage Demand: As we profiled in our 2Q Themes presentation and illustrate in charts 3 & 4 below, price remains in an interesting spot with the supply environment arguing for moderate price acceleration while lagged demand trends imply moderate deceleration. Over the TTM those countervailing forces have largely produced a stalemate with demand trends culling a slight advantage. With price performance across housing equities strongly correlated to 2nd derivative price trends historically, current HPI trends sit as a modest drag for the complex.


About Case Shiller:
The S&P/Case-Shiller Home Price Index measures the changes in value of residential real estate by tracking single-family home re-sales in 20 metropolitan areas across the US. The index uses purchase price information obtained from county assessor and recorder offices. The Case-Shiller indexes are value-weighted, meaning price trends for more expensive homes have greater influence on estimated price changes than other homes. It is vital to note that the index’s printed number is a 3-month rolling average released on a two month delay.
Frequency and Release Date:
The S&P/Case-Shiller HPI is released on the last Tuesday of every month. The index is on a two month lag and therefore does not reflect the most recent month’s home prices.
Joshua Steiner, CFA
Christian B. Drake
