The big question that will be answered in the intermediate-term is the effect of credit contraction, repayment rates, and land values on farmer input consumption trends. As we’ve highlighted with our recent calls in the Ag. space, we believe a deterioration in these metrics will prove meaningful:
- The Chicago Farm Loan Repayment Index contracted from 43 at the end of Q4 to 32 through Q1 (-44% Y/Y) while the Chicago Fed Farm Loan Demand Index increased to 156 from 134 through Q4 (+11% Y/Y) – The Chicago Fed Fund Loan Availability Index was flat Y/Y.
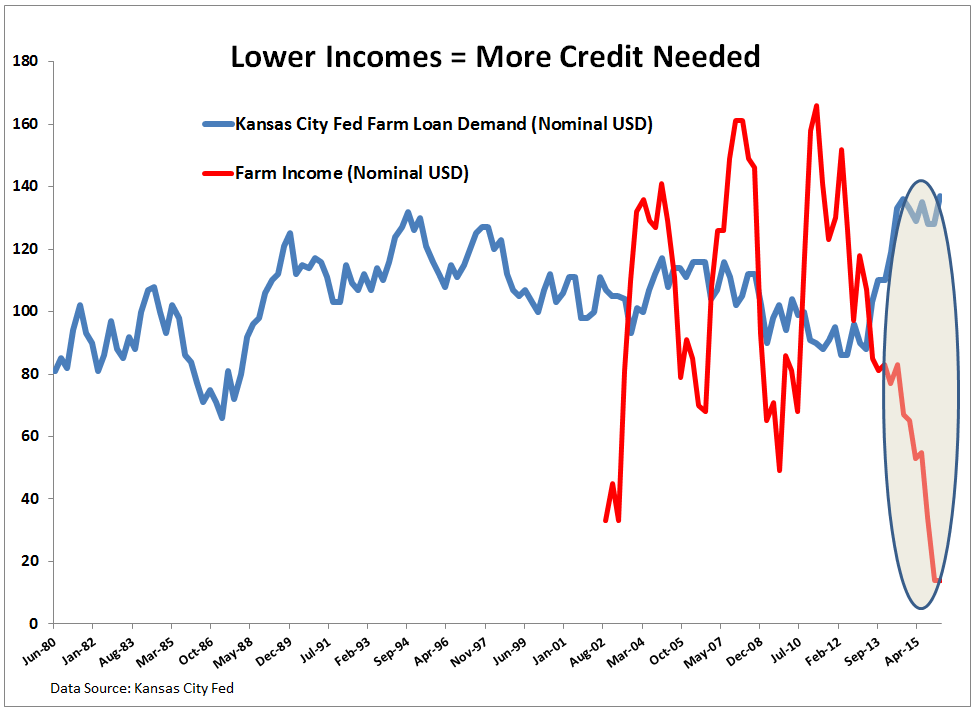
- The Kansas City Fed Loan Demand Index (nominal USD) is +6.2% Y/Y through Q1 and the Kansas City Fed Farm Income Index (nominal USD) is -73% Y/Y.
- The Federal Reserve Bank of Chicago 7th District measurement of farmland values shows that farmland values are down -4% Y/Y, the largest rate of deceleration since Q3 of 2009. Cash rental rates for the 7th district are down -10% Y/Y.
- Without having received updated data on past due real estate loans secured by farmland, loans 30-89 days past due were up 33% Y/Y through Q4, and there is no evidence to suggest a reversal in this trend.