If it wasn’t for companies like LINN Energy (LINE, LNCO), this job wouldn’t be any fun… We’ve had SHORT LNCO on our Best Ideas List since 3/21/13 ($38.60/share), and it’s been quite the roller coaster. But considering where LINN is today, we believe that the short case is as strong as it’s ever been. We reiterate our negative view, and fair value price of ~$9 - $10/unit (~70% downside).
First off, LINN is still the subject of an SEC inquiry that is at least focused on LINN’s “use of non-GAAP financial measures and disclosures related to [its] hedging strategy” (LINE 2013 10-K pg. 117). We have written ad nauseum about both of these issues; while there’s no telling what the SEC will or won’t do, nearly all of LINE’s DCF would be instantly erased should the SEC require a realistic representation of LINN’s maintenance CapEx. That risk cannot be ignored, though we’re not counting on it happening and we don’t have to – LINN’s fundamental outlook is bleak enough.
The Berry Petroleum (BRY) merger has closed and LINN is now bigger, slower-growth, more oil-weighted, and with a significantly higher full-cycle cost structure. The deal – which was supposed to be immediately accretive to “DCF” and actually isn’t – has failed to help LINN much at all, in our view. What it did do was expose a higher % of LINN’s cash flows to a steeply-backwardated WTI curve, which likely will be a problem; and create 94MM new LINE units (increasing the unit count by 40%) that each get a $2.90 annual distribution (for now).
LINN will be around free cash flow neutral in 2014 with zero-to-LSD organic production growth (it is also possible that LINN’s organic production growth goes negative this year). The entire distribution, ~$960MM in 2014, will be funded with new debt and equity capital. LINN had $9.1B of net debt as of YE13, and will have ~$10.0B at YE14 (~4.7x our 2014 EBITDA estimate) absent an equity raise. LINN’s organic production growth is stalling and its materially-understated (~$800MM/year by our estimates) maintenance CapEx is becoming more of an obvious and ridiculous issue.
Since announcing the BRY deal, California crude differentials have collapsed and natural gas prices have increased, squeezing cash margins on the acquired assets. LINN is now net short natural gas! NGL prices spiked in January and February, led by propane, but have already begun to come off and should continue to trend lower through at least the spring and summer; LINN’s 2014 NGL price guidance is aggressive, in our view.
LINN has told anyone that will listen how transformational a sale/swap of its Wolfberry/Wolfcamp assets will be; the sell-side seems (easily) convinced, and we’ve had several conversations with buy-siders that inform us how wrong we are on LINN because this asset has “changed the game.” The optimism is overwhelming, and a lot of it is already priced in. However, most don’t seem to realize that LINN is going to have to monetize PDP reserves (i.e. cash flow) at a significant discount to where LINN’s equity is currently trading. Will the undeveloped acreage command a price high enough to make the entire sale/swap accretive? We think that it’s going to be tougher than most believe... And with respect to LINN’s credibility in valuing non-producing assets, know that LINN has written off ~900 Bcfe of PUD reserves over the last three years. Disappointing results in the once-highly-touted Granite Wash/Hogshooter play led to an $800MM impairment charge this year alone (pretty amazing that this imminent write-down was not disclosed in the LINN/BRY S-4, right?). In our opinion, the Permian sale/swap is just another tree for the bulls to stare at; a convenient distraction from the weak operational and financial results, which we discuss below.
-----
On the 4Q13 Results……First, we debunk the alleged “beat.” Reported DCF came in at $202MM vs. $171MM guide, +$31MM. $14MM, or 45% of the “beat”, was from “adjustments to the purchase prices of acquisitions,” which is, in our view, highly aggressive to include in DCF (see our previous work on LINN for more on this adjustment) and was not in the guidance. Second, a contribution from BRY was not included the guidance, but contributed to LINN’s results for 15 days given the Dec. 16th close. BRY generates ~$2MM/day of EBITDA, so we’ll estimate that BRY contributed $30MM of EBITDA to the Q. Maintenance CapEx above the guide was $12MM, add $3MM of interest expense, and we get a ~$15MM DCF contribution from BRY to LINN’s 4Q13 results, and that was not in the guidance. So really, there was no material DCF beat.
Production ex. BRY for the Q came in at 845 MMcfe/d, below the midpoint of guidance (840 – 860 MMcfe/d). Natural gas production was particularly weak, coming in at 441 MMcf/d (including BRY) vs. guidance of 447 – 460 MMcf/d (excluding BRY). Underperformance in the Mid-Con and Hugoton Field (weather issues?) were the likely culprits. Expect Mid-Con production to continue to decline (and at a faster clip) in 2014 as LINN moves from 8 rigs in the Granite Wash to 4 rigs by mid-year. LINN will only spend ~$170MM in the Granite Wash in 2014, versus ~$600MM in 2012 and $600MM in 2013.
Clean EBITDAX in 4Q13 was $377mm, missing consensus by 10% ($423mm per Bloomberg). Open (ex. derivatives) EBITDAX was $319mm. Clean net income was +$0.15/unit; excluding the impact of derivatives, LINN lost $0.09 in the quarter. Consensus was looking for EPU of +$0.26. On an clean/open basis, LINN lost $0.16/unit in 2013. LINN does not generate profits from producing oil and gas.
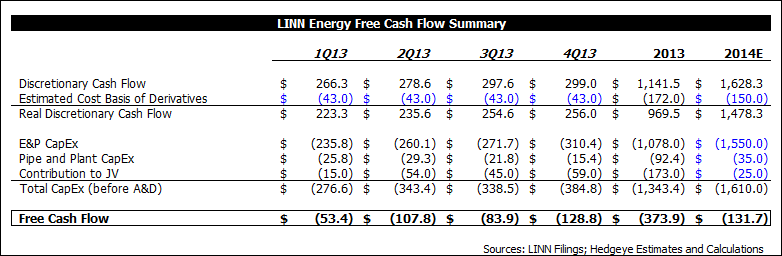
Total CapEx (E&P + Plant + JV) increased $46MM QoQ to $385MM in 4Q13; E&P CapEx was $310MM, up $39MM QoQ. Discretionary Cash Flow (CFFO before changes in WC) was flat QoQ at $299MM (before a deduction for premiums paid on settled derivatives).
Free cash flow (gasp!) was negative $86MM in 4Q; deducting another $43MM for the cost basis of settled derivatives in the period (our estimate, LINN no longer discloses it) gets us to a true FCF deficit of $129MM in 4Q13. For the full year, FCF was negative $202MM, and negative $374MM including the cost basis of settled derivatives (we estimate it to be $172MM). See the table below:
LINN will be around FCF neutral in 2014, so the entire ~$960MM of distributions will be financed with new debt and equity capital. Net debt at YE13 was $9.1B – it will climb to ~$10.0B by YE14 assuming no equity raise. By our estimates, LINN’s debt-to-EBITDA ratio will be ~4.7x at YE14. LINN does not have a debt-to-EBITDA covenant ratio, but management has stated before that it’s comfortable ~3.0 – 3.5x. LINN is not in jeopardy of tripping any leverage covenants, but its debt will increase by ~$225MM/Q! as long as it continues to pay the current distribution. Every distribution paid dilutes the enterprise value by an equivalent amount.
-----
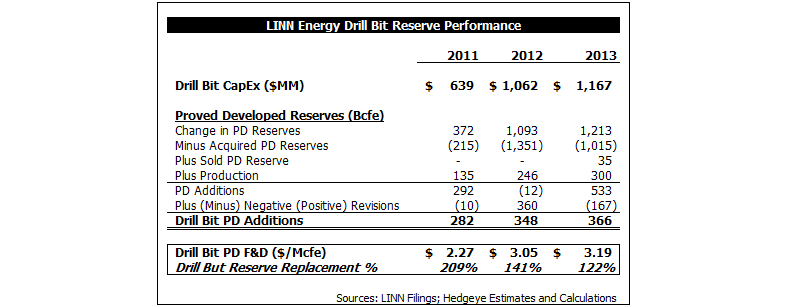
2013 Organic F&D Results......In our view, the “Reserve Replacement Metrics” that LINN published on page 12 of its 2/27/13 Investor Presentation are misleading, because LINN compares drill bit capital expenditures with changes in total reserves, rather than just developed reserves. Specifically, their “cost-to-add per Mcfe” metric is flat wrong. Of the 527 Bcfe of “extensions, discoveries, and other additions,” 390 Bcfe (74%) of them were proved undeveloped reserves (PUDs) (that will probably get revised lower at some point in the future, given the trend)! When analyzing F&D results, one needs to compare drill bit capital employed to the organic change in proved developed reserves; this is where the rubber meets the road – turning capital into production and cash flow, not PUDs.
In 2013, LINN’s Drill Bit PD F&D cost was $3.19/Mcfe (this is the REAL “cost-to-add”), and reserve replacement was 122%. The trend over the last three years has not been good – F&D costs are trending higher and reserve replacement is trending lower. Going forward, we expect LINN’s F&D costs to continue to trend higher as it employs capital into BRY’s capital-intensive, oil-weighted asset base. See the table below for a summary of LINN’s organic PD F&D and reserve replacement metrics from 2011 - 2013:
-----
LINN’s Maintenance CapEx Guidance is Nonsensical……We just don’t know what else to say about this – it’s a complete joke. Let’s try and make sense of the 2014 guidance... 1Q14 production is guided to 1,070 – 1,100 MMcfe/d and full-year 2014 production is 1,070 – 1,140 MMcfe/d.
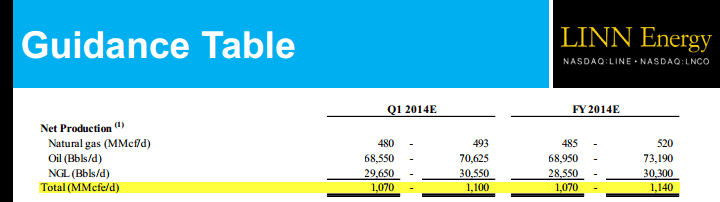
The guidance implies virtually no production growth (indeed, 0% at the low end of the range) as we move through 2014, yet the total CapEx guidance of $1.6B is DOUBLE the maintenance CapEx guidance of $802MM??? So LINN will spend ~$400MM/Q to keep production about flat on a sequential basis, but tells us that maintenance CapEx is ~$200MM/Q… How does that work? If we think about this rationally, LINN’s ENITRE capex budget (and perhaps more) is maintenance. If we were to include that amount in LINN’s 2014 DCF guidance, DCF falls to $0.49/unit (-83%). What yield target should we put on that? How about 10%? $4.90/unit stock price…
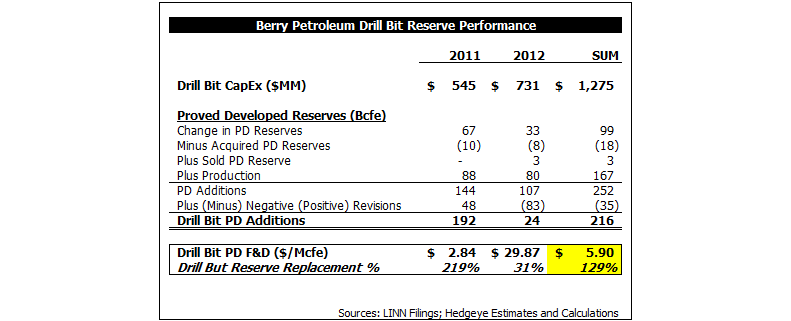
Another way to think about maintenance capex is the cost of replacing produced reserves.
As calculated in the prior table, LINN’s PD F&D was $3.19/Mcfe in 2013. However, BRY’s asset base is significantly more capital intensive than legacy LINN’s; BRY’s drill bit PD F&D cost was $5.90/Mcfe ($36/boe) on average in 2011 and 2012 (see Table below). We estimate (with incomplete information) that BRY’s 2013 PD F&D cost was ~$5.00/Mcfe (~20MM boe of organic additions with costs incurred of $600MM). We expect LINN’s drill bit F&D cost to increase significantly in 2014 as it employs capital into BRY’s California and Uinta heavy/waxy crude properties. LINN will produce ~400 Bcfe in 2014. Assuming an F&D of $4.00/Mcfe ($24/boe) in 2014, it would cost LINN $1.6B to replace produced reserves. This F&D assumption could be too low, which would mean that LINN’s guided $1.6B total CapEx budget will not be enough to replace produce reserves/keep production flat over the course of 2014 (wire-to-wire, Jan 1 to Dec 31).
-----
The 2016 Revenue Cliff……By our calculations, assuming flat production and strip commodity prices, LINN’s revenues in 2016 will drop by $272MM from 2014, which is 28% of LINN’s 2014 nominal DCF guidance. The issue worsens from there – by 2018 LINN’s oil and natural gas revenues will be $521MM below 2014, 54% of guided 2014 DCF. See the table below:
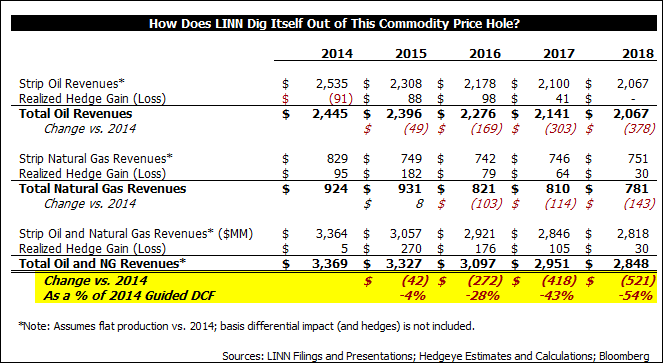
LINN has ~120 Bcf of natural gas swapped in 2016 at ~$1.00/Mcf lower than it is in 2014 and 2015, so that’s a $120MM revenue hit there. And then LINN only has 60% of its crude hedged in 2015 and 2016, and the existing hedges are all above the current strip prices. LINN’s management is a talking out of both sides of its mouth when it tell investors that it likes to hedge 100% of production for five years, but won’t go out and swap the BRY oil volumes, because doing so would lock in the revenue decline.
How is LINN going to dig itself out of this one?
The only legitimate hope is a big rally in oil and NGL futures, because LINN has ~100% of its natural gas production hedged through 2017. By our estimate, the 2016 WTI swap has to move from the current price of $84 to over $105 for oil and gas revenues to be flat with 2014.
Absent a material step-change higher in WTI futures, LINN is in trouble and will have to get creative...
Does LINN start playing games with the hedge book again? Maybe buy some in the money puts? Maybe pay cash to increase that 2016 natural gas swap price? It wouldn't surprise us – here’s the disclosure to justify something like that:
“Although it is the Company’s practice to acquire or modify derivative instruments with external sources of funding, any cash settlements on derivatives are reported as operating cash flows and may be used to fund distributions” (LINE 2013 10-K, pg. 64).
-----
On the Potential Permian Sale/Swap……LINN is working to monetize its Midland Basin Permian assets in some form, and plow the proceeds back into shallower-decline, mature, producing properties; this is the new flavor-of-the-month bull case that LINN supporters have clung to, as nearly every other aspect of this story has disappointed. But is it really that great of an idea?
First off, it is important to know that LINN is really selling two different assets here: PDP reserves (i.e. cash flow), primarily from a vertical Wolfberry program started in 2010, currently producing 17,000 boe/d with an average first-year decline of 35%; and 55,000 net undeveloped acres with Hz. Wolfcamp potential (no current cash flow).
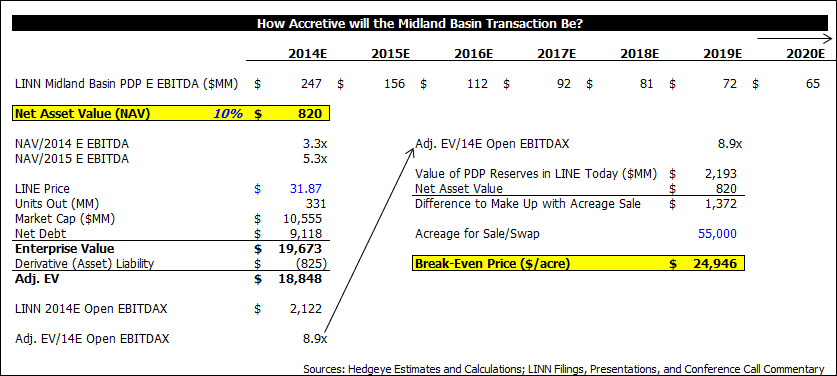
LINN has expensive equity (~8.9x EV/2014 Open EBITDA; $104,000 EV/boe/d) because it financially-engineers an out-sized distribution, which investors value the equity off of. With LINN’s equity trading at a significant premium to its NAV, is it really a good idea for LINN to sell producing assets? Perhaps, but only if the price LINN gets for the undeveloped acreage exceeds the dilution created by selling the PDP reserves at NAV.
So what's the PDP asset worth? We know it’s currently producing 17,000 boe/d, the first-year average decline is 35%, and it’s primarily vertical Wolfberry wells. That’s enough information for us to be dangerous. Using strip prices, we estimate that the asset will generate $247MM of open EBITDA in 2014 and $156MM of open EBITDA in 2015; the big YoY drop is due to the steep production decline and backwardated commodity curves. The net present value of this cash flow stream (we have it cash-flowing through 2045) at a 10% discount rate is $820MM. That’s our net asset value (NAV), and around what we think LINN could sell it for.
The NAV of $820MM works out to 3.3x 2014 EBITDA and $48,000/boe/d of current production. With LINE currently trading at ~8.9x EV/Open EBITDA and $104,000/boe/d, it has a large hole to fill with the sale of the undeveloped acreage in order to make this deal accretive. On a 2014 EV/EBITDA basis, we estimate that LINN has to sell the 55,000 net acres for ~$25,000/acre to prevent dilution (this is the math in the table below). On an EV/boe/d basis, LINN has to sell that acreage for ~$17,000/acre to prevent dilution.
We don’t know what LINN will get for this package in a sale or swap. It’s broken up into eight packages across several different counties, and the range of comparable transaction metrics is wide (~$5k/acre - $35k/acre). Consensus seems to be around $15k - $25k/acre. The point that we are making here is that consensus is likely to be disappointed, whatever the number ends up being, because most are not considering the dilutive sale of the PDPs.
-----
Updated LINE Valuation……We value LINN using a sum-of-the-parts NAV, as well as on an EV/EBITDA basis. Our LINE fair value is ~$9 - $10/unit, and believe that LNCO should trade at a discount to LINE given the future tax liability. In our LINE NAV calculation, we value LINN’s proved reserves at 90% of the YE13 SEC Standardized Measure given the steeply backwardated oil curve not reflected in that metric, and LINN’s history of consistently writing down proved reserves (917 Bcfe of negative performance and timing revisions over the last 3 years; $1.3B of impairment charges over the last two years). We value LINN’s entire Hz. Wolfcamp acreage at $18,000/acre – really a best guess and in-line with consensus. Our target EV/EBITDA multiple is 5.0x 2014, a slight premium to the average multiple of similarly slow growth, large cap, North American E&Ps: APA, APC, COP, DNR, DVN, OXY, SU, and WLL (4.8x on average). We are probably being too generous to LINN here – LINN’s outsized leverage, below-peer organic growth, ongoing SEC inquiry, and questionable accounting and hedging strategy likely more than make up for LINN’s tax-exempt status as an MLP. See the table below:

-----
Miscellaneous Points
- The California crude price – an important one to LINN now – is back to a discount to WTI. When LINN announced the BRY deal in February 2013, California crude was trading at a ~$12/bbl premium to WTI. On an annual basis, BRY produces 7 – 8 MMbbls of California crude. The differential collapsing from +$12/bbl to the current -$1/bbl is a ~$100MM hit to annual revenues (and EBITDA, DCF, etc.).

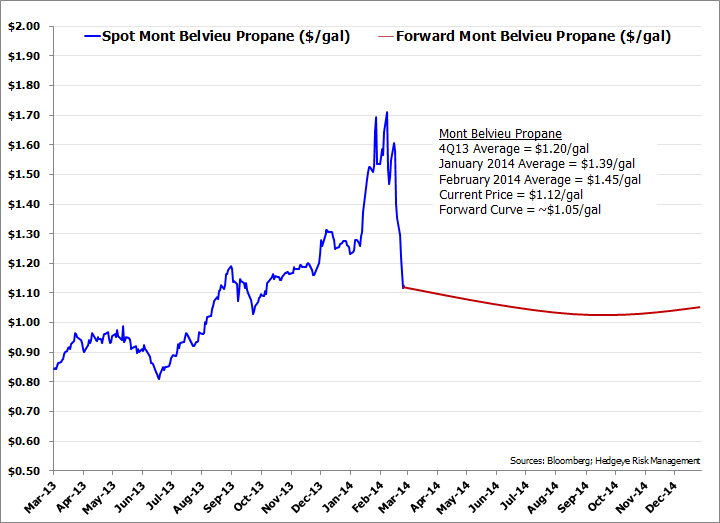
- LINN is guiding its NGL price to $40/bbl in January, February, and for the full-year 2014. This doesn’t make sense. The NGL barrel (propane in particular) spiked in January and February on a temporary shortage, and has already traded off hard to a price below the 4Q13 average. The Mont Belvieu propane forward curve for the rest of 2014 is ~$1.05/gal, versus the spike to ~$1.40 – $1.70/gal in January/February. LINN’s realized NGL price in 4Q13 was $32/bbl – with the propane forward curve where it is, it’s hard for us to believe that LINN's realized NGL price will be much higher than that in 2Q14 – 4Q14… This commentary from LINN’s CFO Kolja Rockov on the 2/27/14 conference call is baffling:
“I would also like to take a moment to discuss the recent increase we've seen in NGL prices. The current composite price of NGLs at Mont Belvieu has increased approximately 11% since the end of the third quarter 2013. This is primarily due to colder than normal weather and increased exports. In particular, propane has been strong, in part due to the continued demand from liquid propane gas, or LPG exports and residential heating. Propane prices have increased approximately 21% and 18% at Mont Belvieu and Conway respectively during the same time. Our NGL production remains unhedged and the continuation of this trend is expected to be very positive to our future financial results.”
- A couple other points on management’s credibility... First, LINN suggested late last year that the BRY deal would be immediately accretive to the distribution – now, it is not, as the 2014 guidance shows. Second, LINN’s base decline at YE13 was in the “mid 20’s” (i.e. ~25%) including BRY… We were under the impression that legacy LINN’s base decline was ~25%, and that it would immediately drop to ~18% with the acquisition of BRY. Guess not.
- Interesting disclosure from the LINN 2013 10-K with respect to LINN, Tallgrass (TEP) and Kinder Morgan (KMI and EPB): "In connection with the Berry acquisition, the Company assumed certain firm transportation contracts on interstate and intrastate pipelines entered into by Berry to assure the delivery of its natural gas to market. These commitments generally require a minimum monthly charge regardless of whether the contracted capacity is used or not. Currently, the Company's natural gas production is insufficient to fully utilize its contracted capacity on the Rockies Express, Wyoming Interstate and Ruby pipelines"
- The cash flow statement looks a little better than it should because LINN acquired $451MM of cash from BRY and netted it against the acquisition line in CFFI. There's nothing wrong with that, but worth knowing when thinking about how the cash moved in and out of LINN's doors in 2013.
Kevin Kaiser
Managing Director
