CHART OF THE DAY: Gong Show In China

11/19/18 09:16AM EST

Editor's Note: Below is a chart (and excerpt) from today's Early Look written by Hedgeye CEO Keith McCullough.

CHART OF THE DAY: Gong Show In China - zgoo

Last week Global Equities continued to trade like they always do when the world is in Quad 4:

  1. SP500 was down for the 6th week in the last 8 losing -1.6% to +2.3% YTD and remains Bearish @Hedgeye TREND
  2. EuroStoxx600 was down another -2.2% last week to -8.1% YTD and remains Bearish @Hedgeye TREND
  3. EM (MSCI) was down (despite USD down) -0.7% last week to -18.1% YTD and remains Bearish @Hedgeye TREND

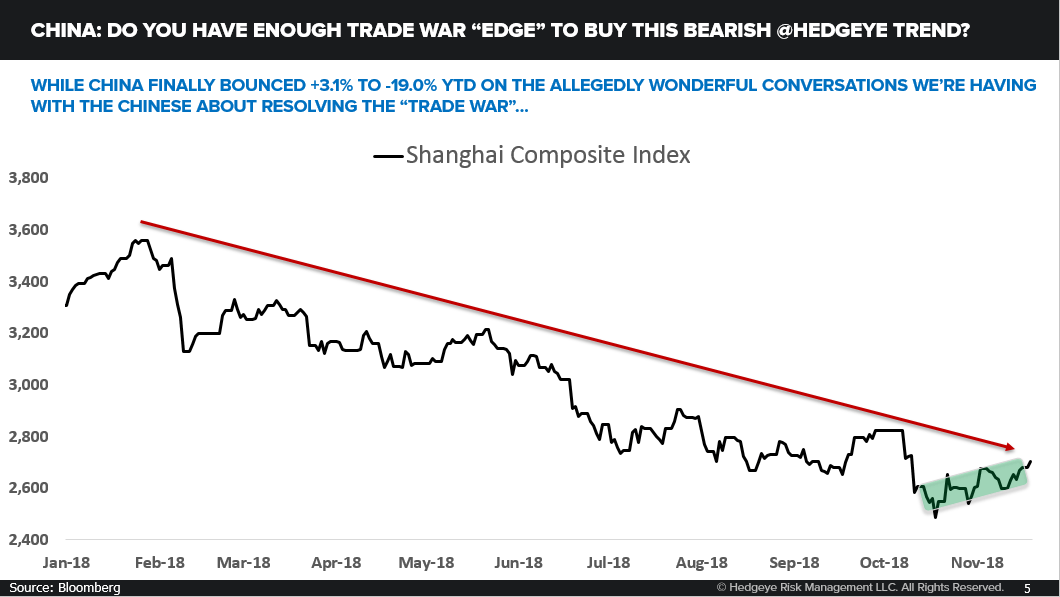
While China finally bounced +3.1% to -19.0% YTD on the allegedly wonderful conversations we’re having with the Chinese about resolving the “trade war”…

Mexico (who Trump saved from said “trade war”, remember?) was down another -4.4% last week to -14.3% YTD and remains Bearish @Hedgeye TREND. So are you buying stocks with that as your catalyst, or do you have a process to map The Cycle?

CHART OF THE DAY: Gong Show In China - 11.19.18 EL Chart

CHART OF THE DAY: Gong Show In China - early look

© 2024 Hedgeye Risk Management, LLC. The information contained herein is the property of Hedgeye, which reserves all rights thereto. Redistribution of any part of this information is prohibited without the express written consent of Hedgeye. Hedgeye is not responsible for any errors in or omissions to this information, or for any consequences that may result from the use of this information.